What are customer dashboards?
Customer dashboards are a visual view of the data your organization has on your customers, whether that is on their experience, their opinions or their purchasing patterns. A customer dashboard takes all your disparate data and brings it into a cohesive visual representation, usually in the form of graphs and charts to make it easier to digest.
Using dashboards allows you to better track your key metrics and your performance against KPIs. It’s easier to see when things change, and insights can be delivered more easily to your team.
You might use customer dashboards to:
- Spot customer trends and habits
- Pinpoint customer issues
- See customer opinions, responses, and expectations
- Direct internal workflows
- Improve the employee experience
- Deliver reports on a regular or one-off basis
Why are customer dashboards important for business goals?
Though customer dashboards might initially seem as though they’re mainly designed to improve internal oversight, customer dashboards can directly influence your ability to achieve your business goals.
For example, customer dashboards can:
Improve customer experience, engagement, and satisfaction
Your customers are constantly providing you with feedback, whether it’s through customer surveys, comments, or customer service messages. If they don’t feel as though you’ve heard them, they begin to feel less connected to your brand and less likely to make purchases.In our research, we found that two thirds of consumers globally said that companies weren’t good at listening to feedback.
With the right customer dashboards, you can see what customers are saying, feeling and thinking, and pinpoint the root cause.. Your team can rapidly address issues such as customer journey pain points with insights delivered automatically based on precise data.
As you react more efficiently to customers’ needs, you can improve customer engagement, customer loyalty and satisfaction by giving them the experience they’re looking for. There’s currently an 8% revenue loss risk when you deliver bad experiences to customers – with the right dashboards in place, you can mitigate this risk significantly.
Streamline operations to increase revenue
Brands are continually looking to improve operational efficiency and productivity in a bid to increase revenue. Customer dashboards, regardless of their focus, can help these efforts simply by working in real time. Research has found that 80% of companies saw their revenues increase after implementing real-time analytics in their business operations. Having access to data as it’s being generated means your team can pivot faster and improve as they go, rather than waiting for periodic reviews of data and actions.
Enhance decision-making and create data-driven insights
Rather than taking action based on siloed data and surface level insights, customer dashboards allow you to make better decisions and take data-driven action. By using sophisticated software to make analyses of your data rather than relying on human resources, you’re able to leverage artificial intelligence and machine learning to generate insights that translate to effective action.
Customer dashboard technology powered by artificial intelligence can manage data absorption and delivery, complete trend analysis, form consistent databases, forecast and predict future trends, and reduce uncertainties. All of this is possible with human effort – but it simply isn’t as effective or efficient. Customer dashboards can better represent important data so that your team can take actions that will have a visible impact.
Experience the game-changing power of Qualtrics Frontline Digital now
Types of Customer Support Dashboards
There are many types of customer dashboards that you can use to improve your business outcomes on the part of your organization, your customers, and your employees.
Here are some common dashboard types and what you can use them for.
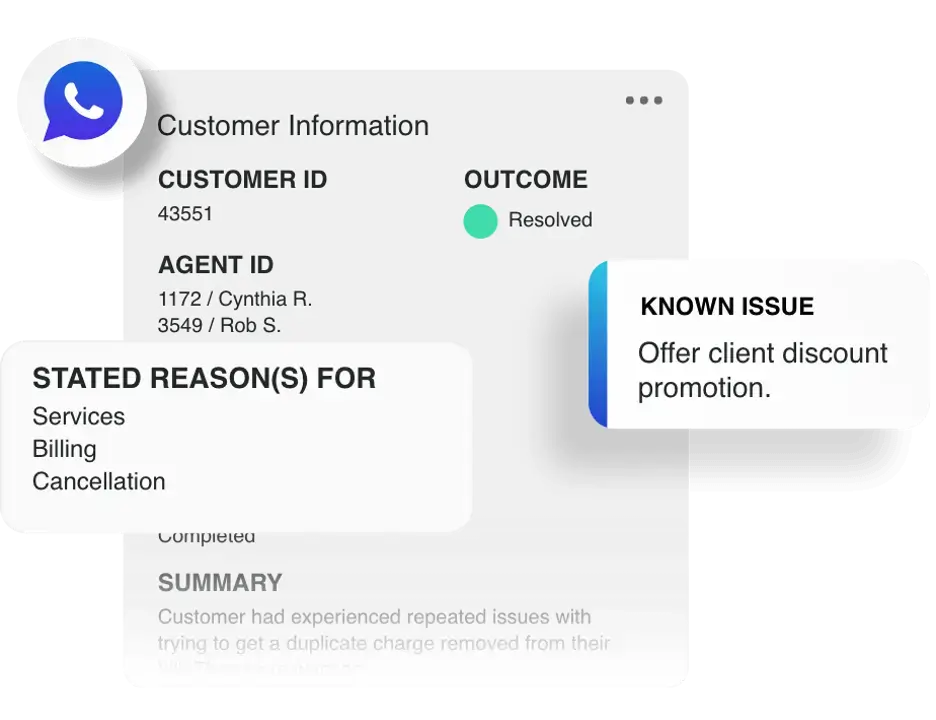
Customer Data Dashboard
A customer data dashboard gives you a comprehensive overview of all customer data and insights. Rather than drilling down into a specific aspect of customer experience, it shows you specific customer data that you need to see.
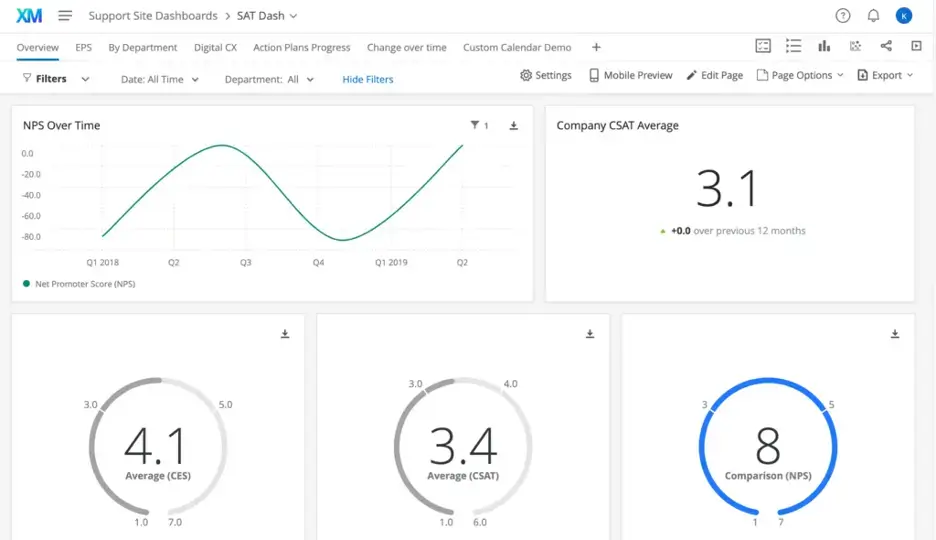
Customer Experience Dashboard
This dashboard is an overview of all your important customer service metrics, giving you a bird’s eye view of how your customers feel and react to your business. This is a more top-level dashboard that can drill down into more specific ones, such as Net Promoter Score (NPS), customer satisfaction (CSAT), customer effort (CES) and more.
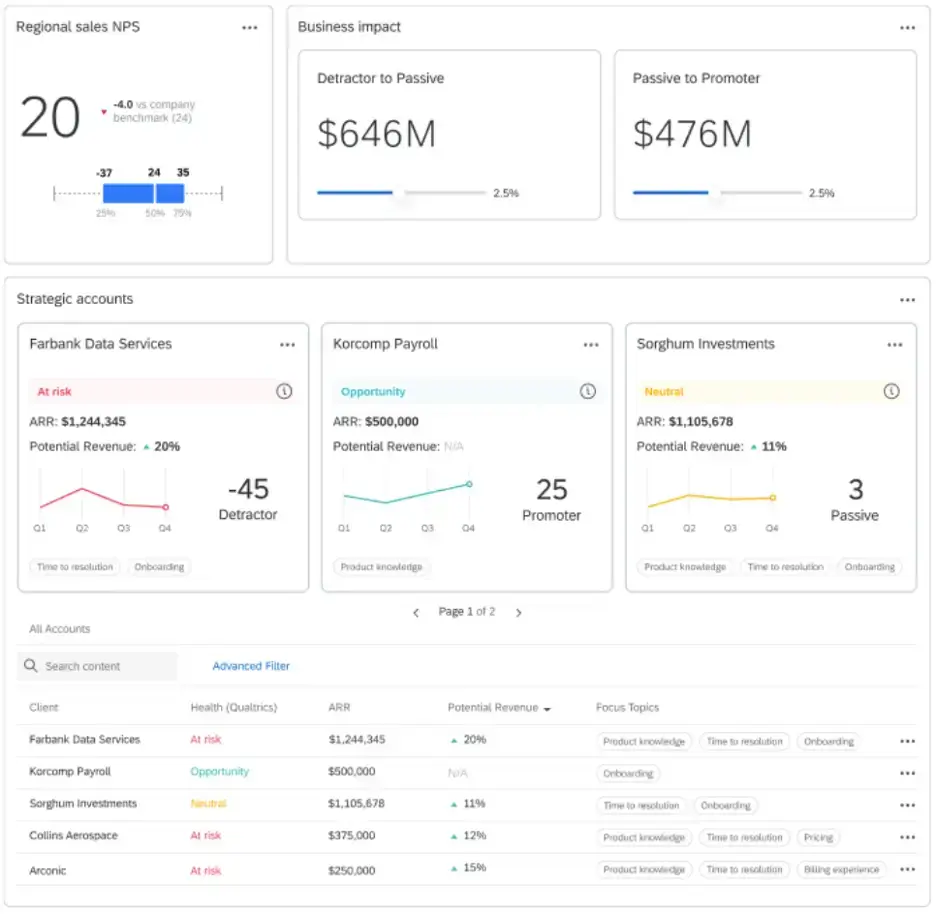
Net Promoter Score Dashboard, Customer Satisfaction Dashboard and more
Delving further into customer experience metrics via a dashboard gives you a more specific view dedicated to the tracking and evaluation of customers’ responses to surveys such as CSATCES surveys. The insights from these surveys can be overlaid with financial information to understand how they impact your business outcomes. In the example below, this dashboard shows NPS directly impact financial results.
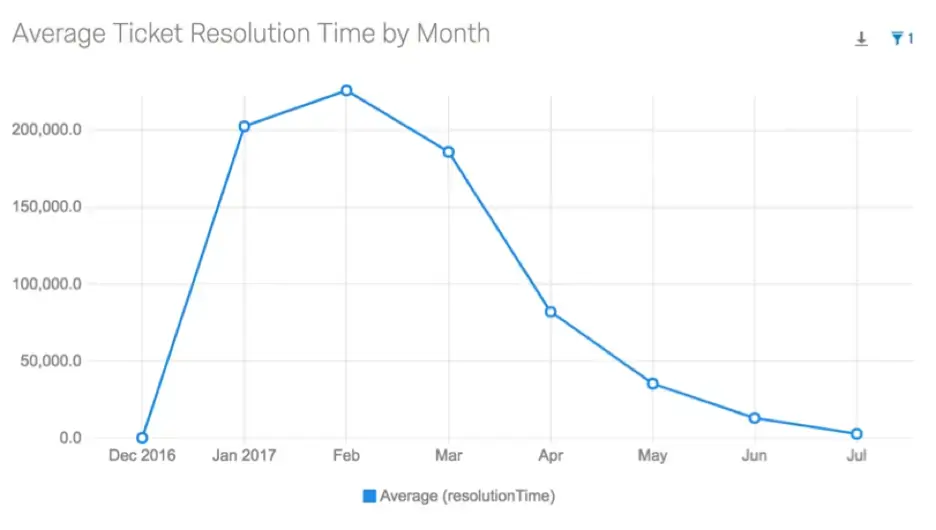
Customer Service Dashboard
Customer service dashboards are useful for tracking customer support metrics and tickets to ensure no issue is left unaddressed. Customer service dashboards can also track employee performance and highlight which customer support issues are becoming a trend. With the right widgets included, your customer service dashboard can track data such as average response time, and clearly see progress over time. This helps you to drive customer retention by improving your customer support function.
Voice of the Customer Dashboard
In the voice of the customer dashboard view, you can see graphical representations of specific topics customers have mentioned in feedback or comments about your brand. This helps you to track sentiment and customers’ views on your brand, allowing you to take action where needed to improve opinions.
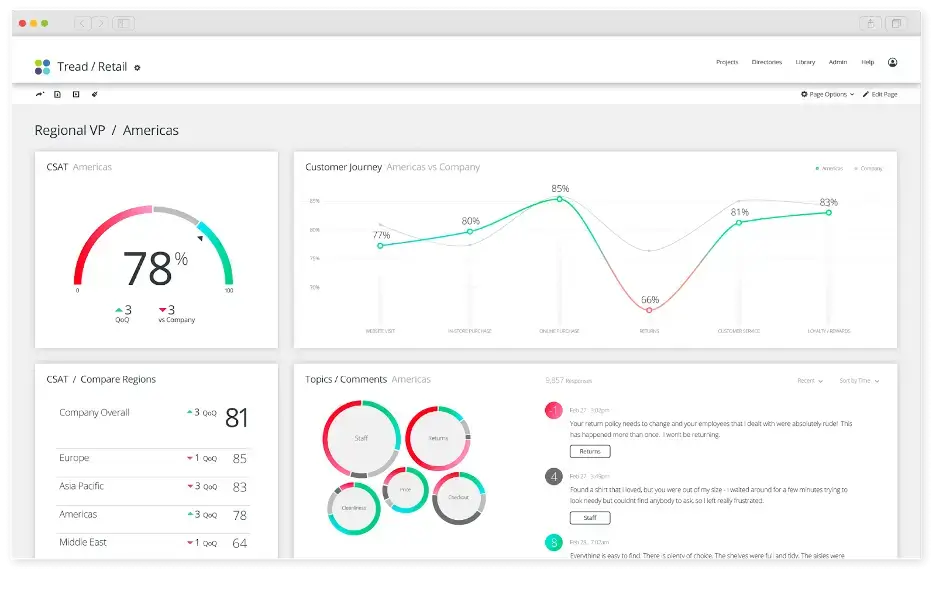
Customer Journey Optimization Dashboard
Your customer journey is a vital part of your customer experience – and orchestrating how your customers move through the marketing and sales funnels requires a good grasp of what’s happening at every stage. A customer journey optimization dashboard can illuminate where customers are losing interest and provide suggestions for better customer retention.
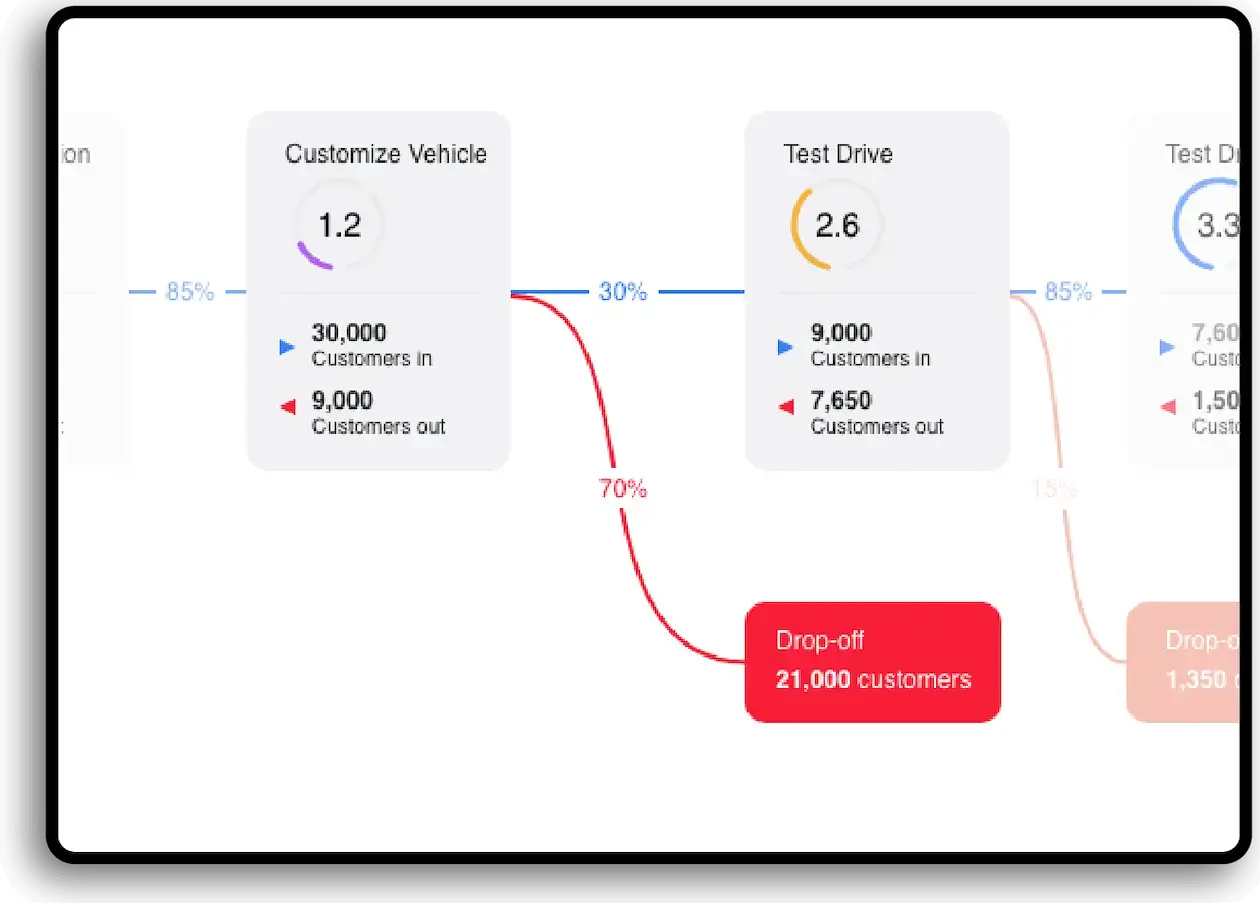
Analytics Dashboards
Analytics dashboards can cover a range of data, from website usage data all the way to financial projections. The dashboard in the example below tracks customer frustration when interacting with various business facets or processes, such as your application process. Getting to a granular level with your dashboards will allow you to fix problems in real time and take strategic action, rather than guessing at what needs work.
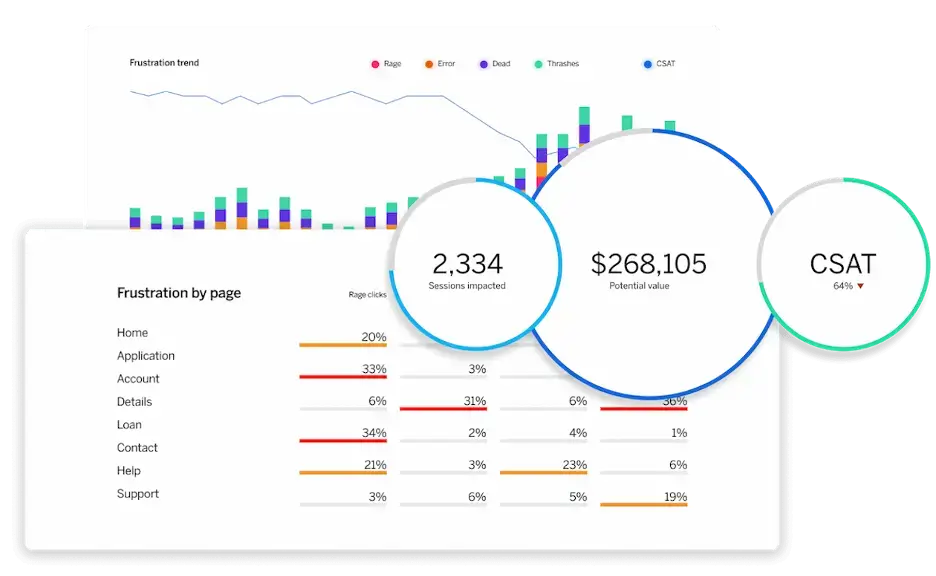
Website App Feedback Dashboard
This is a comprehensive dashboard view that allows you to see all feedback on your website app, distilled into various trends for easy comprehension. For example, this might collate numerical ratings of your app as given in feedback, or show word cloud representations for the most common comments on your website performance and more.
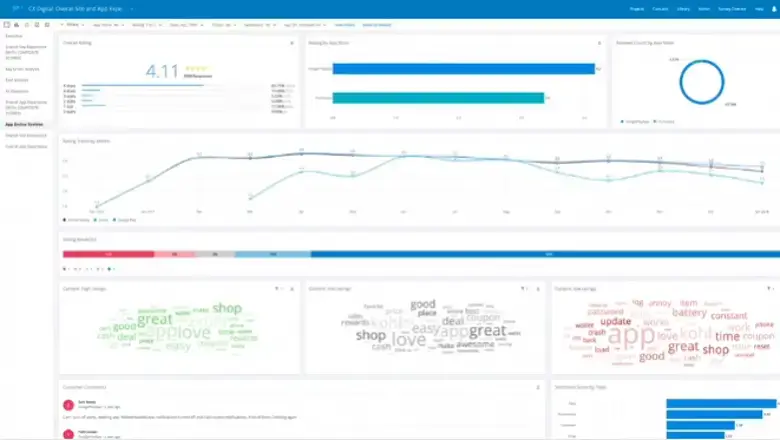
Quality Management Dashboard
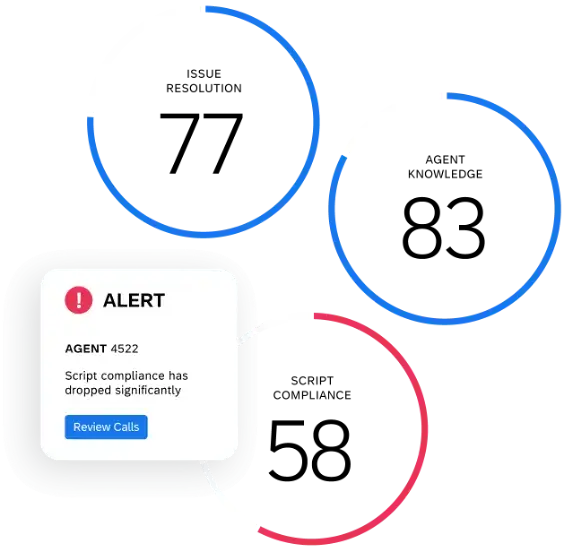
A vital part of monitoring internal performance, a quality management dashboard brings all of your customer service agents’ work to life in the form of graphs and charts to help you see where improvements can be made. Was the agent knowledgeable? Were they able to solve the customer’s issue?
Online Reputation Management Dashboard
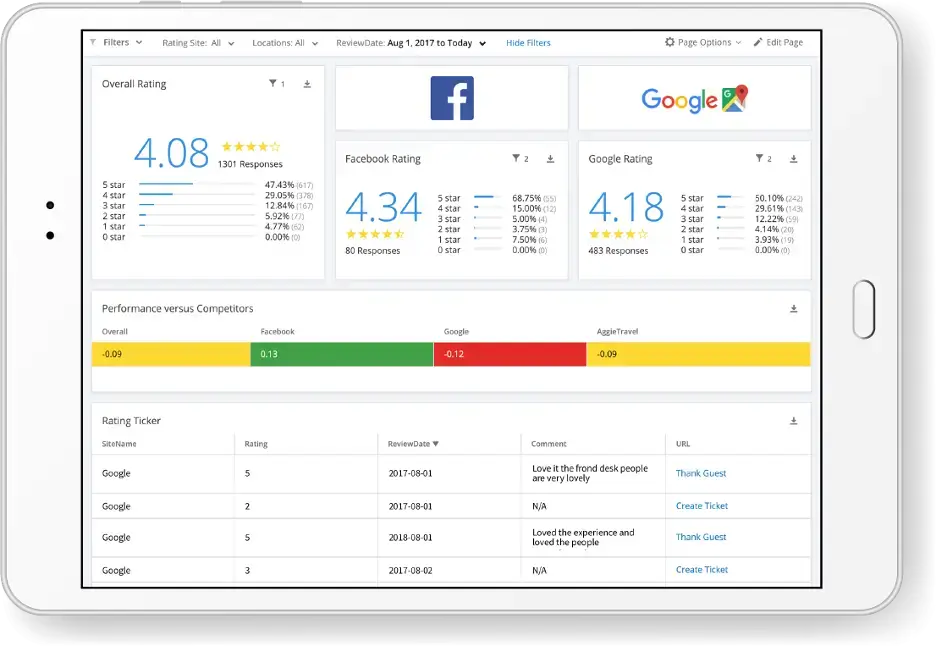
Rather than searching across various platforms for information on your online reputation, this type of dashboard brings together the ratings your brand receives across the internet in one place. It can also collate ratings for an overall rating, and pull in specific comments for analysis.
Frontline Feedback Dashboard
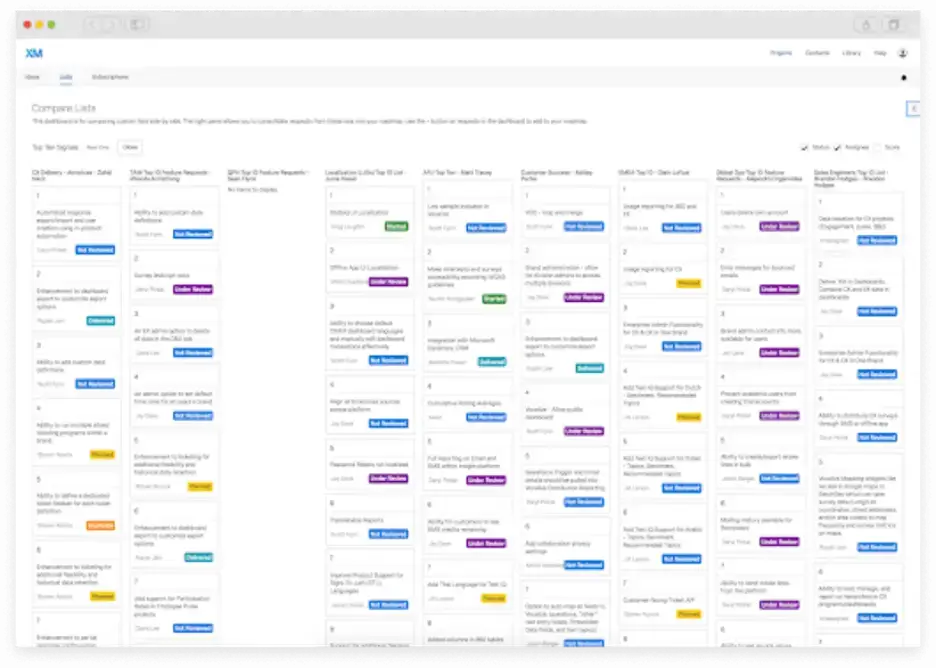
Your employees’ voices are also important for reaching your business goals. Without analyzing your employees’ feedback and views, your understanding of how your brand is performing is incomplete. A frontline feedback dashboard can draw your employees’ comments and ratings together in one place, allowing you to understand where improvements in process can be made easily.
Best practices for implementing customer dashboards
When you implement customer dashboards, you’ll need to follow best practice to ensure you get the most out of your software. Our recommendations for best practice when it comes to implementing customer dashboards are:
1. Identify key metrics and key performance indicators to track
Establishing which metrics you want to track and which KPIs are the most important to work towards will help you to customize your customer dashboards effectively. Rather than viewing all information, you’re able to narrow down your dashboard visualizations to the key data insights your customer service team and more needs to be effective.
2. Set up automated data feeds and alerts
Missing out on an action or important data flag can seriously hamper your ability to deliver on customer promises. Setting up an automated system of data feeds and alerts that can integrate with other software your team commonly uses can help to eradicate silos and ensure that critical information is seen at the appropriate time.
3. Establish clear goals and benchmarks for dashboard performance
Your dashboard needs to work effectively to improve your operations. To avoid creating dashboards that don’t serve their full purpose, it’s sensible to establish clear goals for dashboard use and benchmarks for performance to ensure that your company (and specific groups such as your customer service team) is getting the most out of your investment.
4. Train employees and stakeholders on how to use the dashboard effectively
Your employees will need to be able to customize and utilize your dashboards to augment their day-to-day performance, meaning training will need to be given to ensure they know how to get the information they need out of the system. Stakeholders are also likely to need training so that they can pull reports and key information when they need to.
Key features of effective customer dashboards
For customer service dashboards and more to be effective, they need to do more than just represent your data in a visually pleasing way – they need to give you clear analytics and insights to help you develop better customer support. Here are some key features that can make your customer dashboards be more effective at helping your business.
Customizable widgets and data visualization
Rather than using a stock approach to your data, customizable dashboards with widgets and data visualization you can manipulate to better understand your data is key. You may require certain visualizations frequently and others on a less regular basis. For example, you might want to view NPS scores overlaid with financial data such as monthly recurring revenue, but only need it on a monthly basis in a report for stakeholders rather than in real-time on a constant basis. You can configure the dashboard to only present you with the information you need, rather than everything you could have.
Real-time data updates
In some cases, you need to be able to see changes as they happen to make timely improvements for better customer satisfaction and other metrics. A customer dashboard system needs to be able to pull in data in real time to keep you apprised of changes as they occur.
Integration with other systems and tools
A customer dashboard system should break down information silos and help bring all your organizational data into one central hub. Equally, it should be able to integrate with common tools and software used in your business to pull in and disseminate data insights to the right teams when they need it.
User-friendly interface and navigation
A complex customer dashboard can be incredibly useful – but if it’s hard to comprehend, set up or use, it will be a hindrance rather than a help to your business. A user-friendly interface with easy-to-use navigation will help your team to get to grips with your information faster.
Easy reporting
Your reporting system – whether it’s for internal use on a real-time basis or for other stakeholders on a one-off basis – should be simple. Your customer dashboard data should be easily distilled into comprehensive reports that can be generated in the click of a button and configured to provide useful information in an instant.
Customer dashboard examples and results
BMW: Personalized, mobile-friendly customer dashboards
Even industry leaders benefit from using customer dashboards for business clarity. BMW’s customer experience program was revitalized using Qualtrics, helping to increase repurchases and return service rates.
Alongside a renewed customer survey program, BMW implemented personalized, mobile-friendly customer dashboards to ensure leadership were able to act on feedback as fast as possible. As a result, the company was able to read every customer comment and respond back to the customer within 24 hours, with issue resolution reduced to 5 days.
Delivery Hero: Data-driven customer support dashboards
One of the best customer service dashboard examples is that of Delivery Hero. Food ordering platform Delivery Hero operates across 39 countries and 4 continents, linking 250,000 restaurants around the world to customers. However, without customer dashboards in place to monitor the customer experience and without clear data analysis to guide their actions, customer service satisfaction was lagging.
By implementing customer service dashboards and gathering customer feedback in one place using Qualtrics, Delivery Hero was able to improve its NPS score by 30% in one year. They were able to identify pain points in the customer journey effectively and take strategic action to improve customer retention and relationships.
Get unrivaled customer insights with Qualtrics customer dashboards
Don’t allow your business data to languish at the cost of your revenue. Utilize the power of artificial intelligence to create customizable customer dashboards with real-time updates and never miss an insight again.
Qualtrics’ customer service dashboard software instantly flags sources of customer friction and guides your frontline customer service teams to the right actions. Improve company-wide processes and build customer lifetime value with data-driven insights pulled from all your vital data.
Watch demo: XM for Frontlines