Response Weighting
About Response Weighting
Imagine that you have a product used equally as often by men and women. But when your customer feedback on this product returns, 70% of your respondents were female, and 30% were male. If you were to present these results as collected, they would skew in favor of the women’s answers, even though they are only 50% of the target demographic.
Response weighting allows you to change the weights of variable fields so the data in your Reports tab will reflect targeted demographics. Wave based weighting can also be used to apply unique weights over various time periods or specific categories, which can be useful for long-running programs that require multiple weighting configurations.
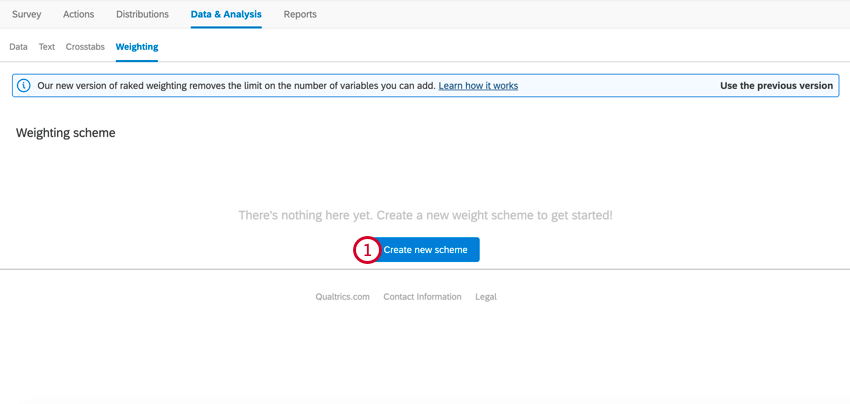
To get started, go to the Data & Analysis tab of your survey and select Weighting.
Adding Weights
- Click Create new scheme.
- Select the type of weighting you want to use.
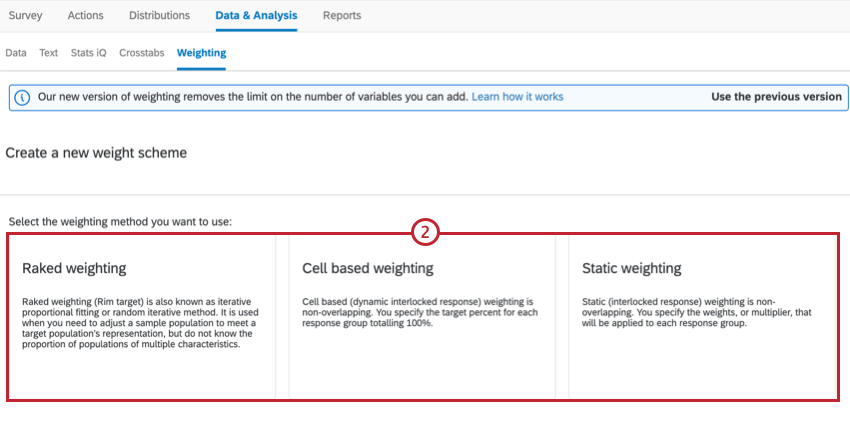
Your options include:- Raked weighting
- Cell based weighting
- Static weighting
Qtip: Check out the section on Raked vs. Interlocked Weighting for more information about these weighting types.
Qtip: If you want to use waved weighting, see Wave Based Weighting. - Click Add a variable.
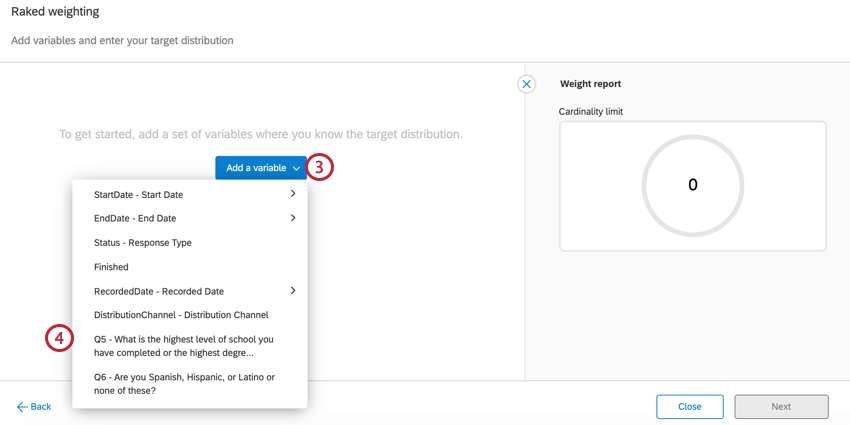
- Choose the variable you want to weight.
- Adjust the weighting for the variable by typing the target values into the appropriate boxes.
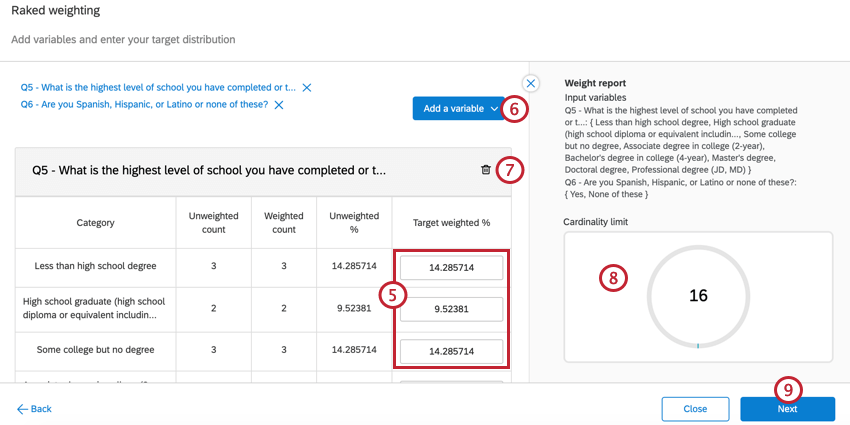 Qtip: This weighting feature has been updated to display 6 digits of precision. This does not alter any existing percentages or weight calculations.
 - To add additional variables to your weighting, click Add a variable and then repeat steps 4 and 5.
Qtip: You can add variables until the Cardinality Limit of your weighting reaches 5,000. See the Weight Reports for more information about Cardinality Limits.
- If you want to remove a variable from your weighting, click the trash can icon next to that variable.
- As you add weights, the Weight report will adjust to show you your Cardinality Limit. You can add variables to your weighting scheme until the Cardinality Limit reaches 5,000. See Weight Reports for more details.
- Click Next. After clicking Next, your weights will calculate which may take up to a couple minutes. The Weight Report will also update to show you information about your weighting scheme.
- Review your weights to make sure everything is correct.
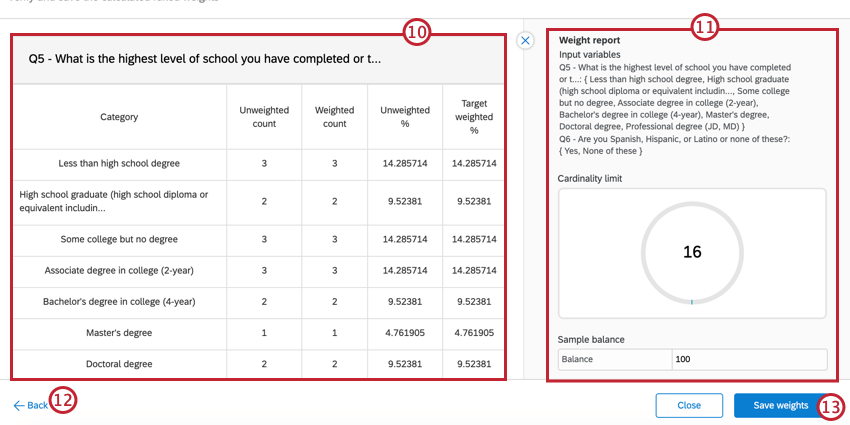
- Read the Weight Report for more information about your weighting scheme.
- If you need to make changes, click Back.
- Once you’re finished, click Save weights.
Weighting Multiple Variables: Raked vs. Interlocked
Raked Weighting
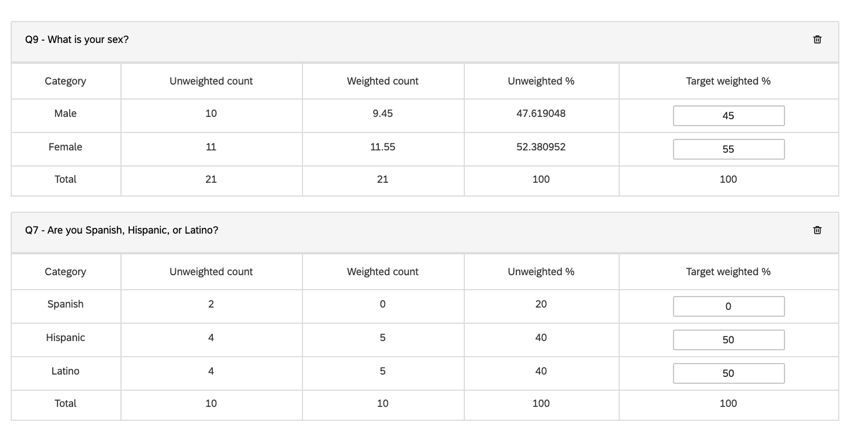
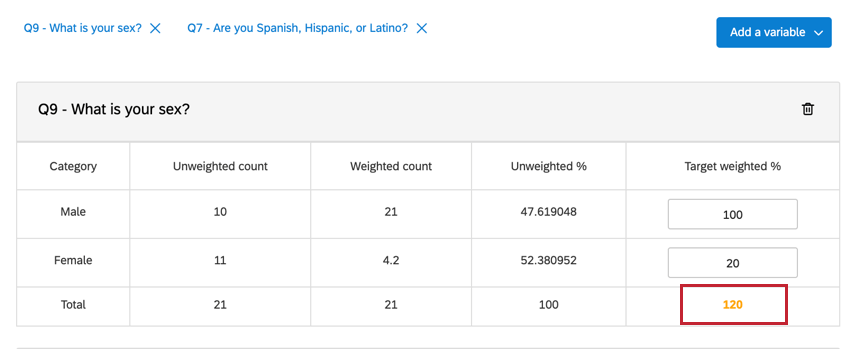
Raked Weighting (also known as Rim target) takes a simplistic approach to multiple variables. You can add up to two variables at a time, and each one is configured separately. This type of weighting is best if you’re looking at non-overlapping variables.
For example, if you wish to weight both Gender and Spanish/Hispanic/Latino identity, you determine your desired percentages of each Gender, then of each identity. The software will then calculate the weights of overlaps (for example, Hispanic Women or Latino Men) for you.
Interlocked Weighting
Interlocked Weighting is useful if you’re interested in targeting overlapping variables. For example, if you have a larger audience of Spanish Women than Spanish Men, you can adjust these percentages accordingly.
There are two different types of Interlocked weighting schemes:
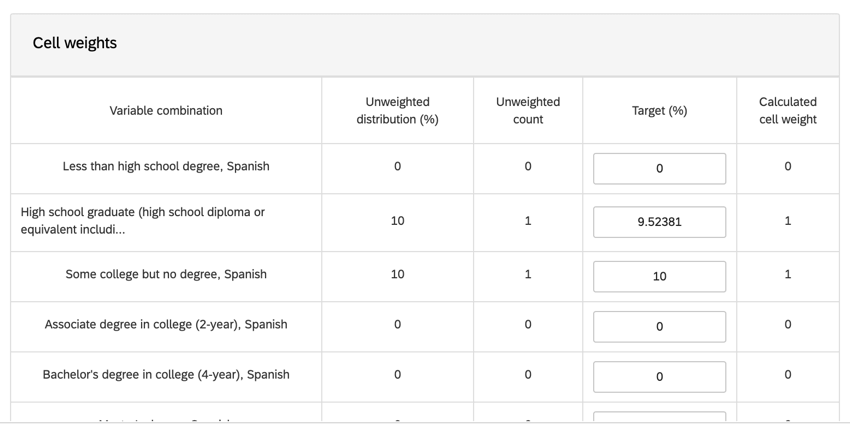
- Cell Based: Also known as dynamic interlocked response. Define values in the Distribution column. These are measured in percentages adding up to 100%. When you define these values, the system automatically defines the Weight column for you.
Qtip: If you are not as familiar with weights, we recommend using this option.
- Static: Also known as interlocked response. Edit the values in the Weight column. These numbers are what the data in a given category will be multiplied by once collected. 1 means no weight is applied.
Wave Based Weighting
Wave based weighting allows you to apply unique weights over various time periods or specific categories.
- Click Create new scheme.

- Enter a name for your new weight scheme.
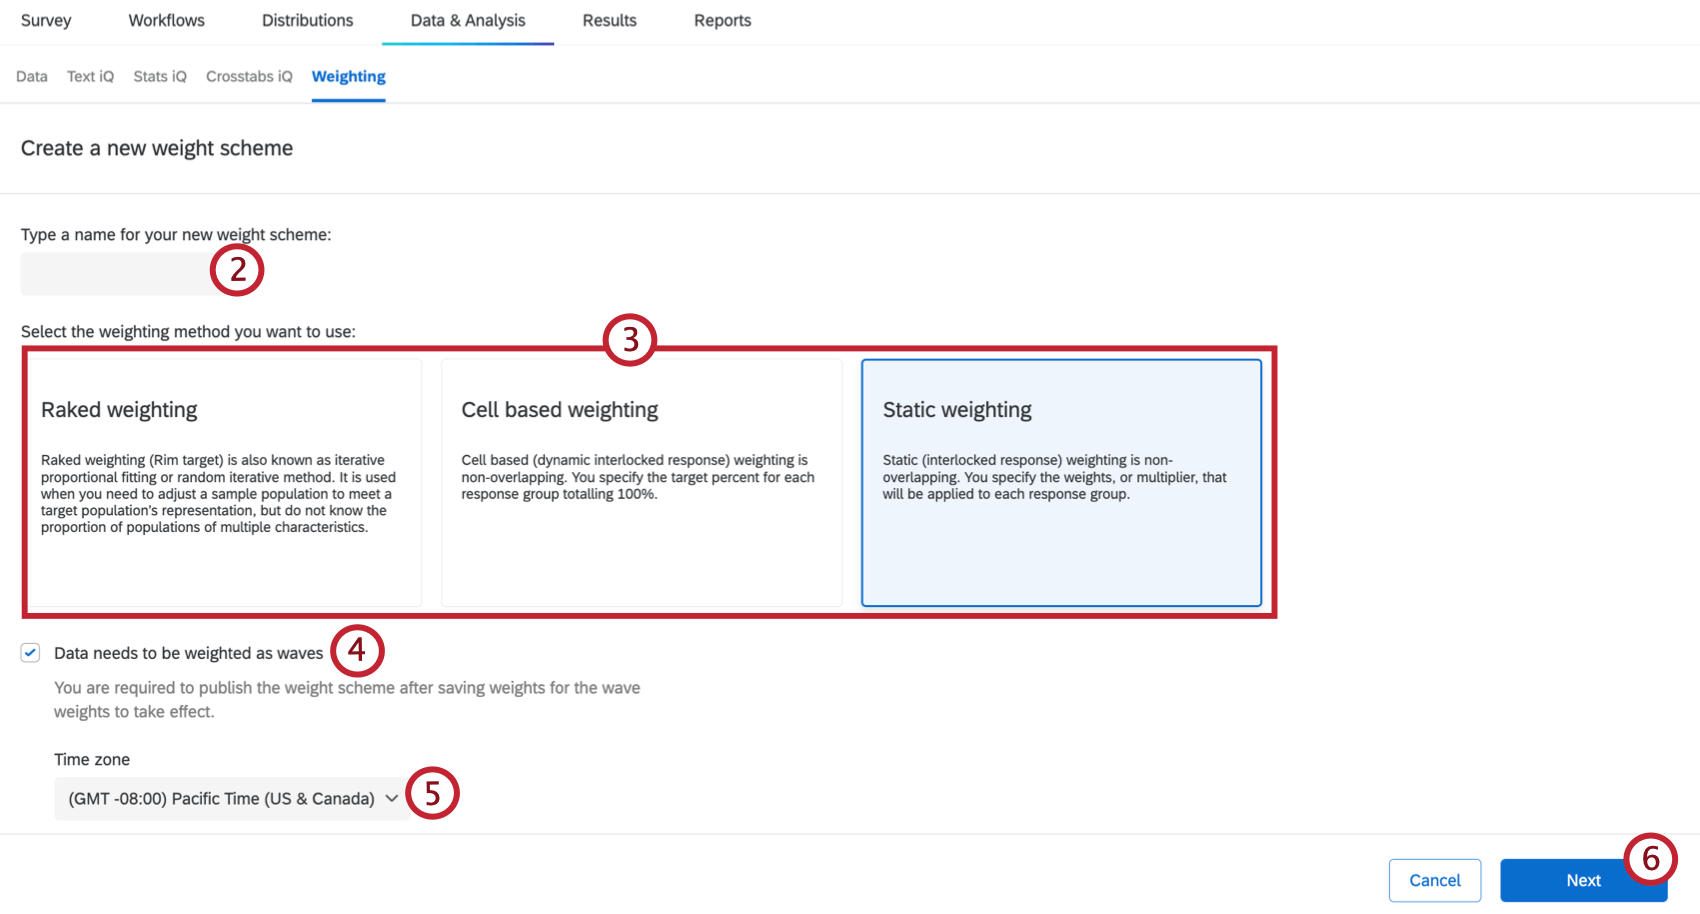
- Select the type of weighting you want to use.
- Raked weighting
- Cell based weighting
- Static weighting
Qtip: See Raked vs. Interlocked Weighting for more information about these weighting types. - Check Data needs to be weighted as waves.
- Select a time zone from the dropdown. If you choose to break out your waves by time periods, these time periods will be set based on your selected time zone.
- Click Next.
- If you want to weight only specific responses, add a filter. Only responses that meet your conditions will be weighted. The number of qualified responses for weighting will update as you adjust your filter.
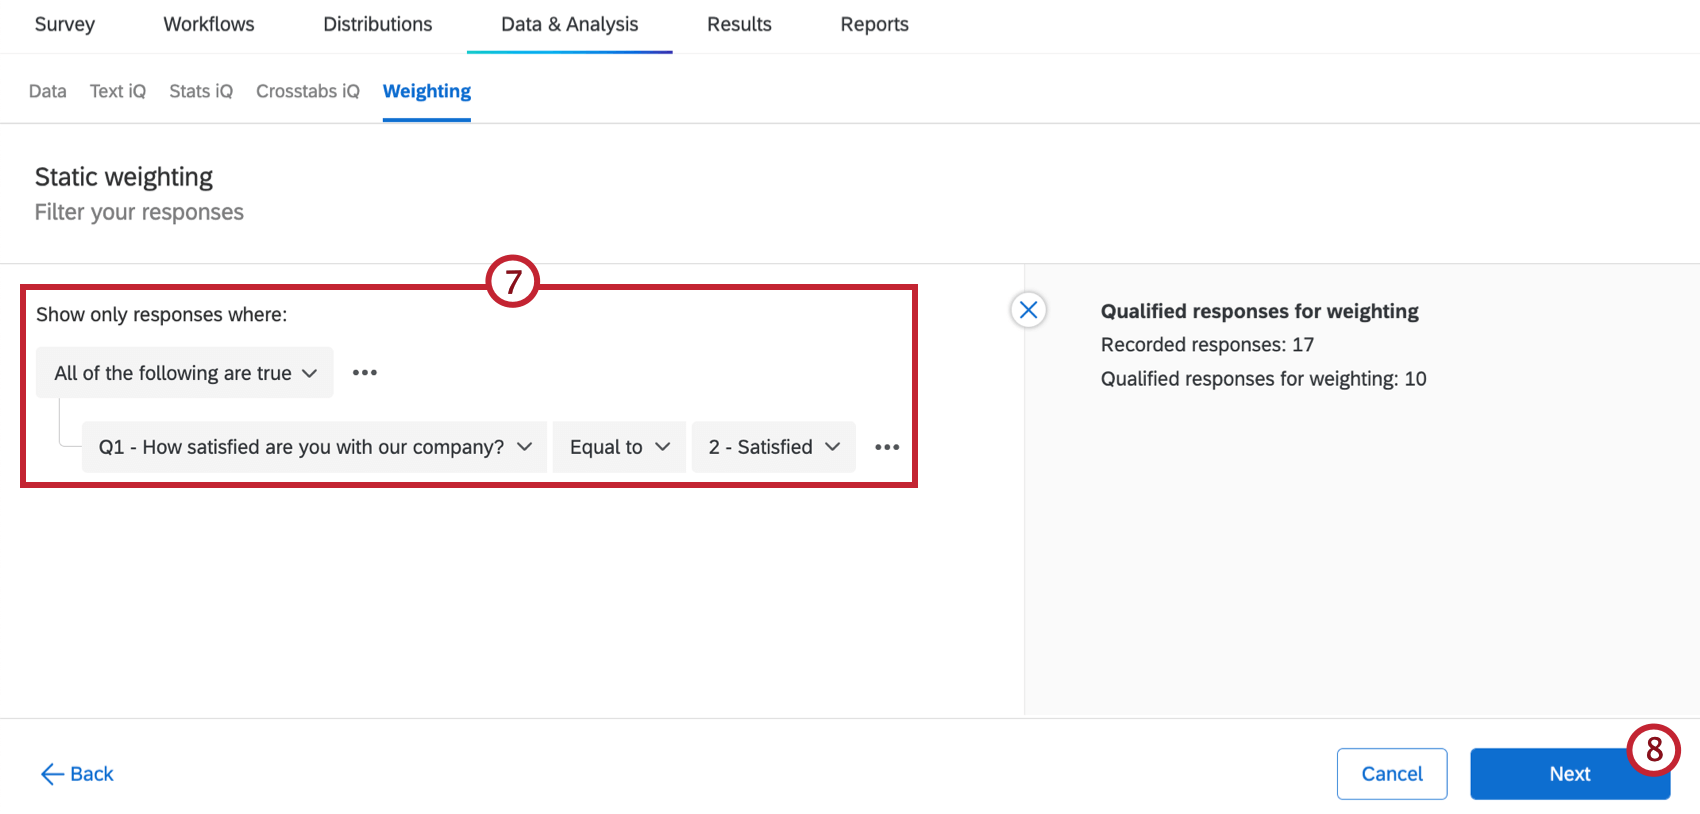 Qtip: If you want to weight all your responses, do not add a filter.
 - Click Next.
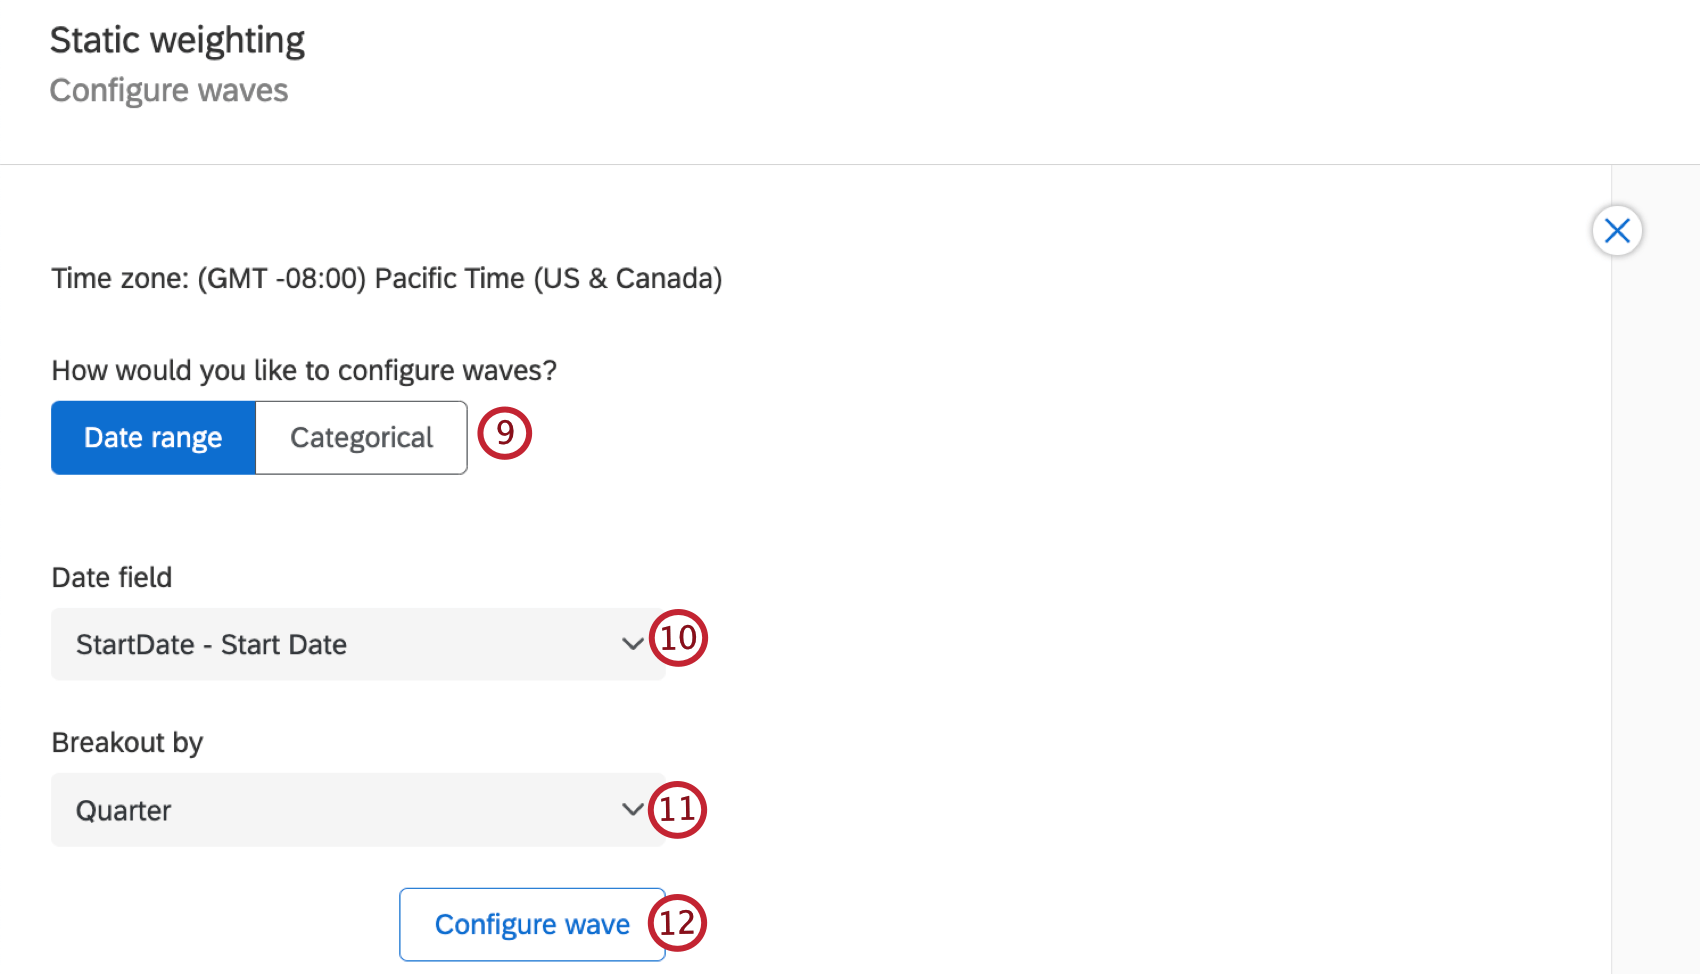
- Select how you would like to configure your waves. Your options include:
- Date range: Waves are defined using a date field, such as Start Date or End Date, and waves are broken out by different time periods.
- Categorical: Waves are created based on non-date fields, such as survey questions or survey metadata.
- Select a field from the dropdown to define your wave.
- If you are configuring your waves with a date range, select a time period for the wave to be broken out by.
- Select Configure wave.
- Select the wave you want to create a weighting configuration for.
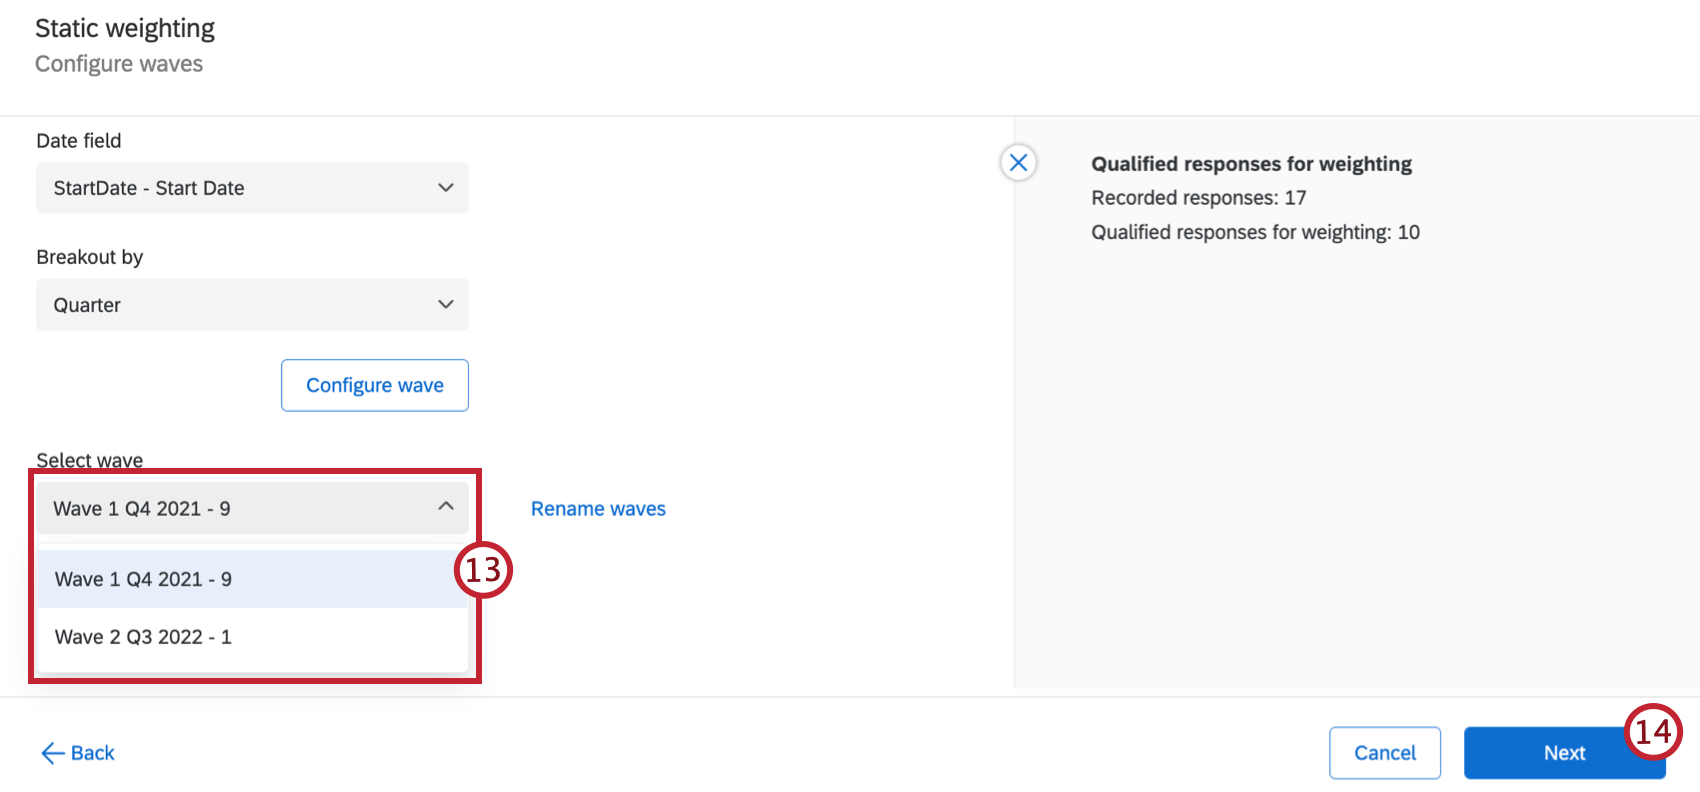 Qtip: Click Rename waves if you would like to give your waves different names.
 - Click Next.
- Decide if you want to Apply the current wave configuration to more waves. You can select specific waves or select All remaining waves. If you leave this option unchecked, your weighting configuration will only apply to the selected wave.
Qtip: If desired, you can rename your wave by typing a new name into the Wave name text box.
- Click Add a variable.
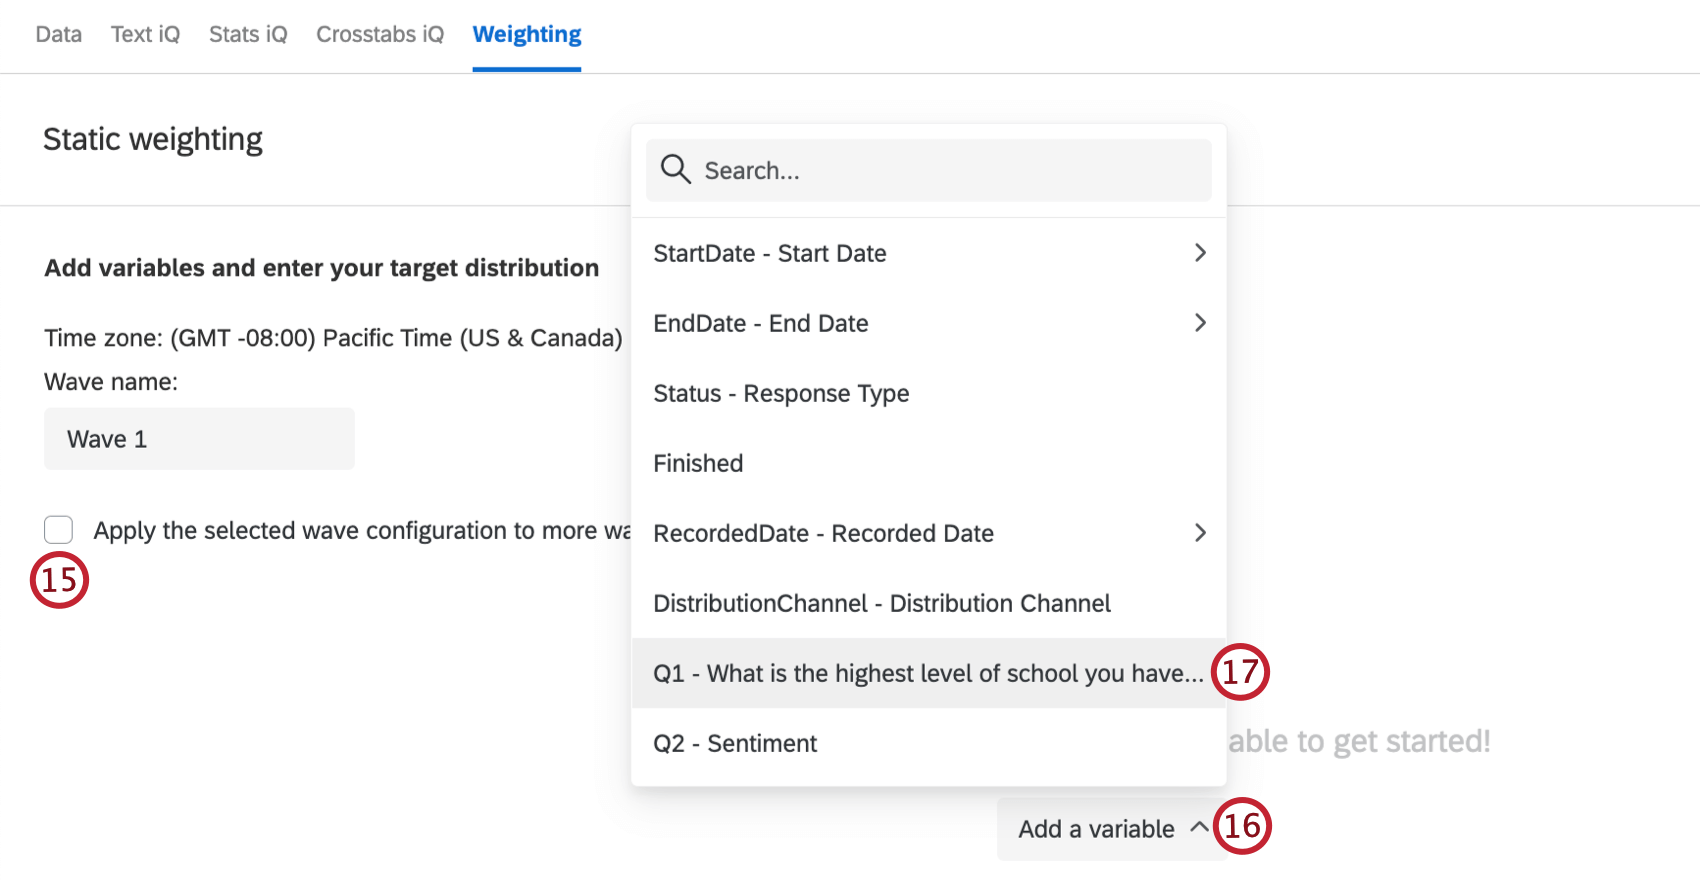
- Choose the variable you want to weight.
- Adjust the weighting for the variable by typing the target values into the appropriate boxes.
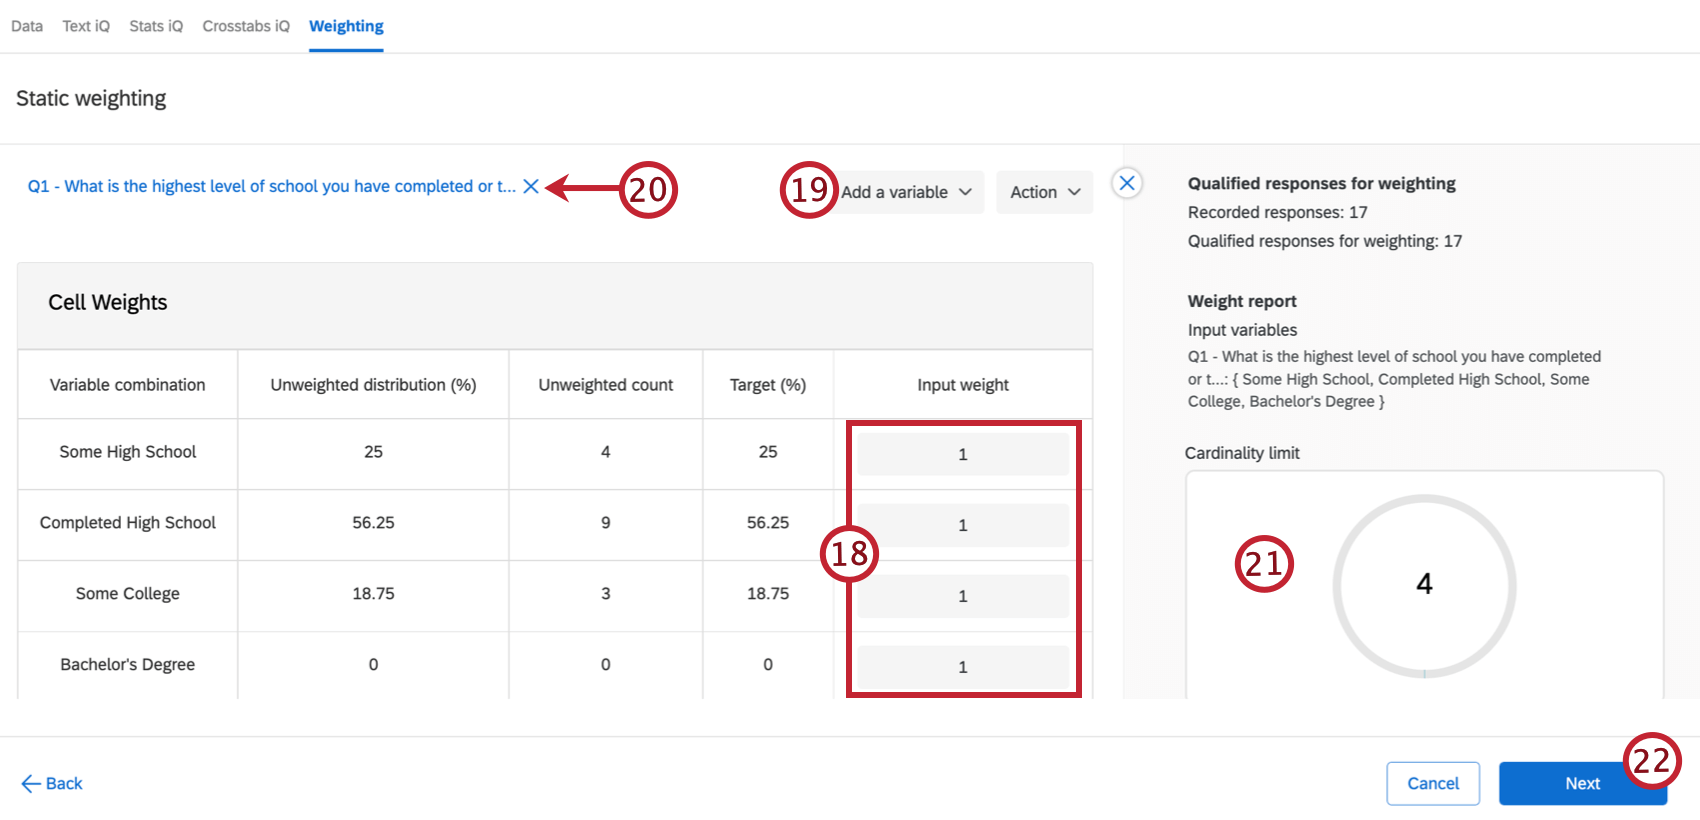 Qtip: You can also import weights using a CSV or TSV, which is useful If you are adjusting the weighting of many variables. See Exporting & Importing Weights for more information.
 - To add additional variables to your weighting, click Add a variable and then repeat steps 16 and 17.
Qtip: You can add variables until the total Cardinality Limit of your weighting reaches 5,000. For example, if your first wave has a cardinality of 100 and your second wave has a cardinality of 200, your total cardinality is 300. See Weight Reports for more information about Cardinality Limits.
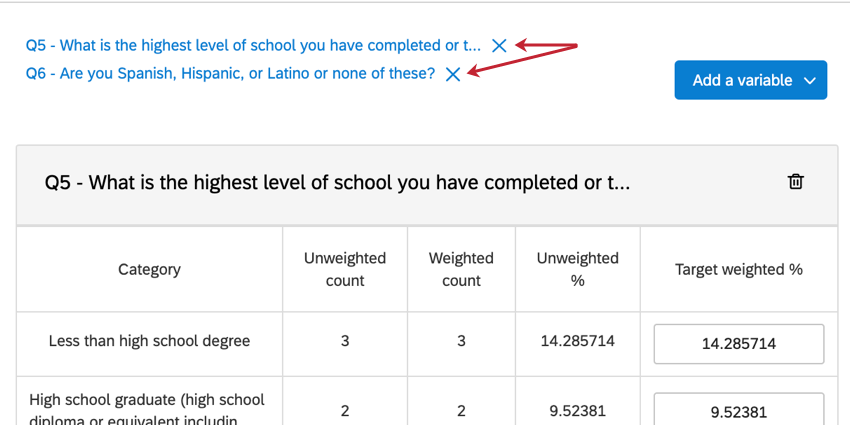
- If you want to remove a variable from your weighting, click the X next to the variable name above your weighting scheme to remove the variable.
- As you add weights, the weight report will adjust to show you your Cardinality Limit. You can add variables to your weighting scheme until the Cardinality Limit reaches 5,000. See Weight Reports for more details.
- Click Next. Your weights will now be calculated, which may take up to a couple minutes. The weight report will also update to show you information about your weighting scheme.
- Review your weights to make sure everything is correct.
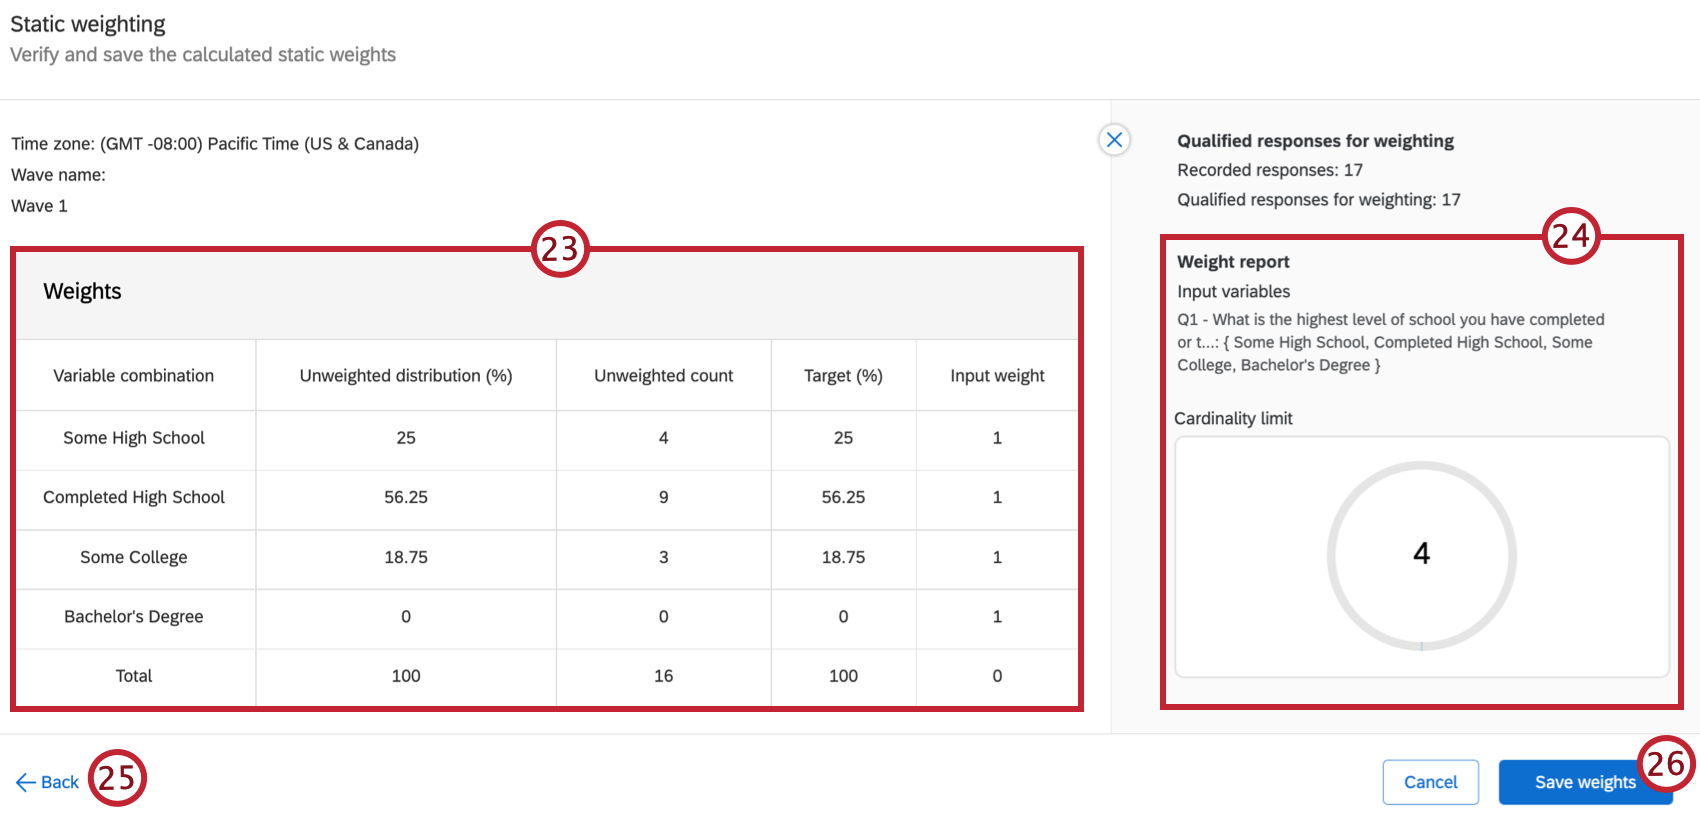
- Read the Weight report for more information about your weighting scheme.
- If you need to make changes, click Back.
- Once you’re finished, click Save weights.
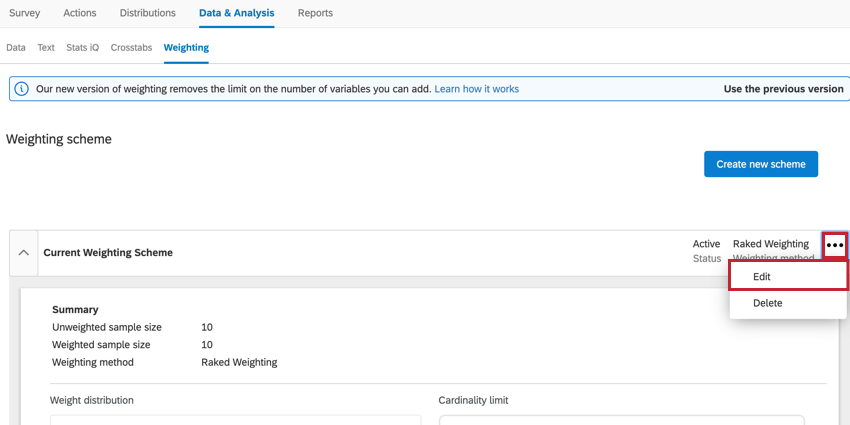
Qtip: If you need to make changes after saving your weights, you can edit them by clicking the three horizontal dots in the top right corner of your weighting scheme and selecting Edit.
Weight Reports
Once you create your weighting scheme, the Weight report will update, showing you key pieces of information about your weighting.
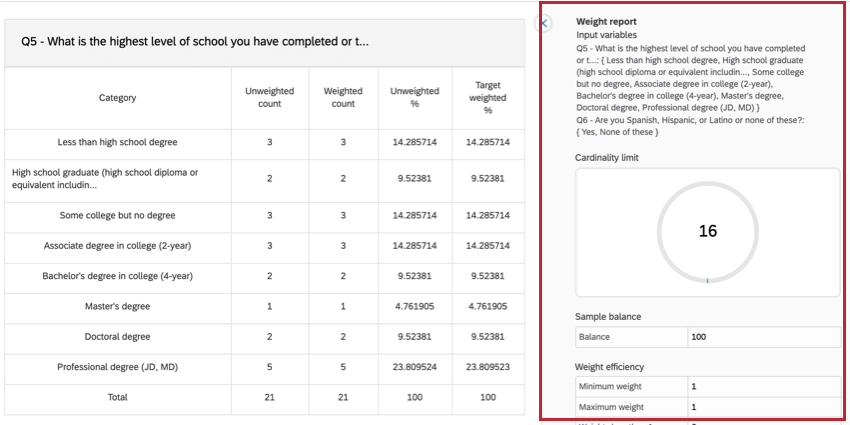
- Input Variables: These are the variables that are being used in the weighting scheme.
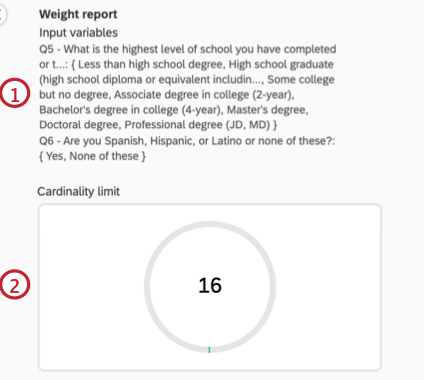
- Cardinality Limit: Cardinality is calculated by multiplying the number of categories for each of your variables together. The Cardinality Limit cannot pass 5,000. The pie chart in this section will adjust to show you how close you are to reaching the Cardinality Limit.
Example: For example, let’s say you are weighting three variables with 10, 5, and 7 categories respectively. Your Cardinality limit is then 350 since that is the product of the number of categories (10 x 5 x 7 = 350).
- Sample Balance: The Sample balance is a measurement of weighting efficiency during rake weighting convergence. As more variables are added, the balance can be driven down when weights are extreme (having very large or very small values), impacting overall weighting efficiency.
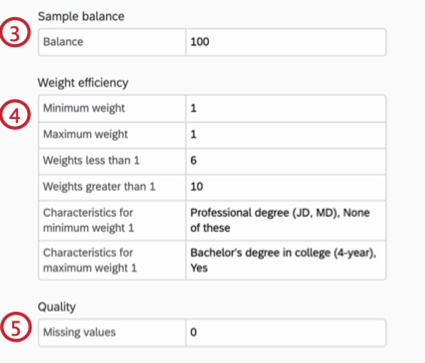
- Weight Efficiency: This section shows you how efficient your weighting scheme is.
- Minimum weight: The minimum weight. This is represented as a multiplier instead of a percentage out of 100.
- Maximum weight: The maximum weight. This is represented as a multiplier instead of a percentage out of 100.
- Weights less than 1: Of all the characteristics you’re weighting, this is the number of characteristics that have a multiplier less than 1.
- Weights greater than 1: Of all the characteristics you’re weighting, this is the number of characteristics that have a multiplier greater than 1.
- Characteristics for minimum weight X: X varies based on what your minimum weight is. Each combination of variables has a corresponding weight. Characteristics for minimum weight are the variable combinations corresponding to the minimum weight.
Example: Let’s say we are weighting education, and we gave “Professional degree (JD, MD)” a targeted weight of 2%, and every other education level a targeted weight above 10%. “Professional degree (JD, MD)” would be our characteristic for minimum weight.
- Characteristics for maximum weight X: X varies based on what your maximum weight is. Each combination of variables has a corresponding weight. Characteristics for maximum weight are the variable combinations corresponding to the maximum weight.
- Quality: This metric shows if any of your variables have missing values (i.e. no respondents selected a specific response value).
Exporting & Importing Weights
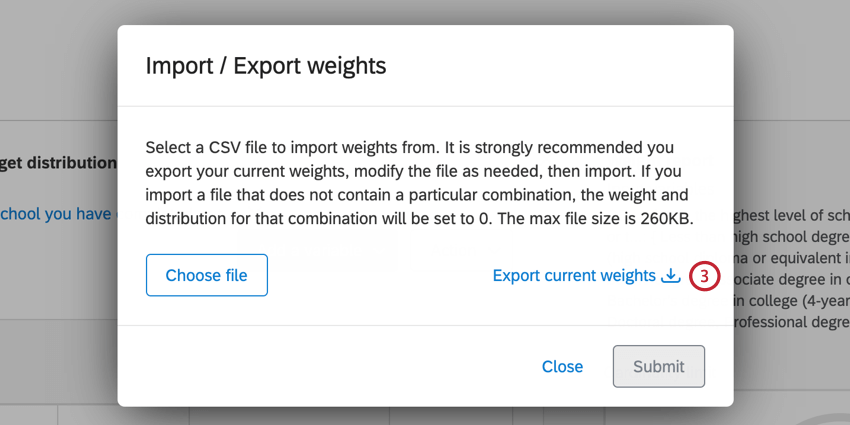
After creating your weighting scheme, you can export the weights so you can easily use them again in the future. This section will go over importing and exporting weighting schemes.
Exporting Weights
- While editing an interlocked weighting scheme, click Action.
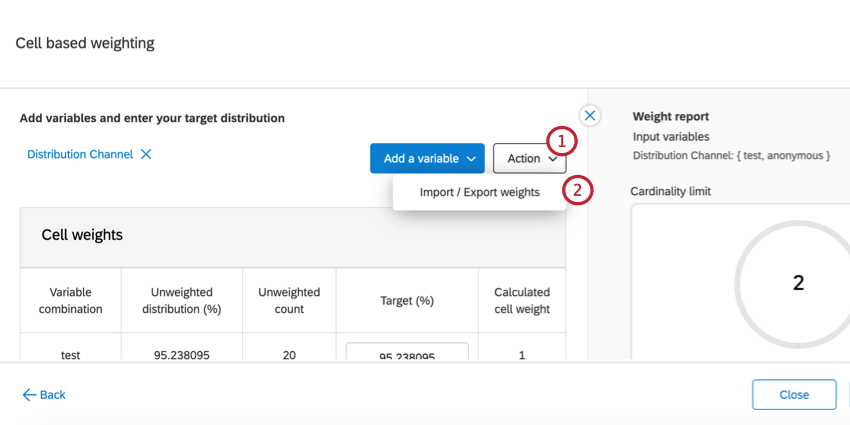
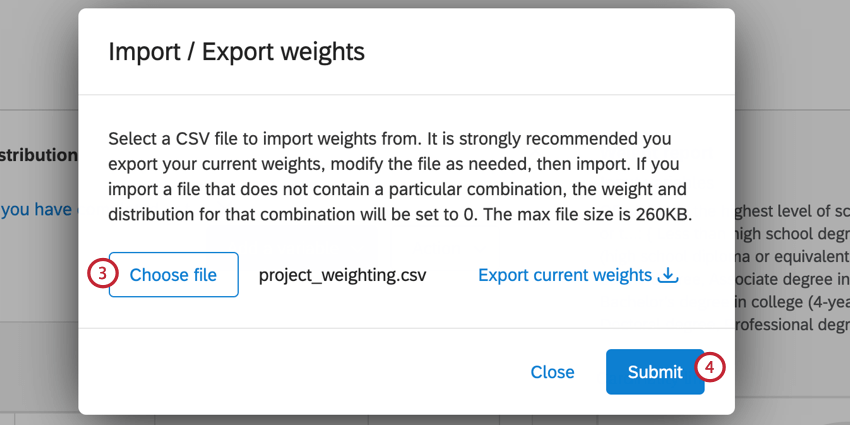
- Click Import / Export Weights.
- Select Export current weights to download a CSV file with your weighting.
Importing Weights
Reports
Response weighting is automatically applied to the reports in the Results tab. You can choose to turn this on or off either at the Global Level (for a whole report), or at the Visualization Level (for a single graph or table).
Turning off Weighting for a Visualization
- Select the visualization.
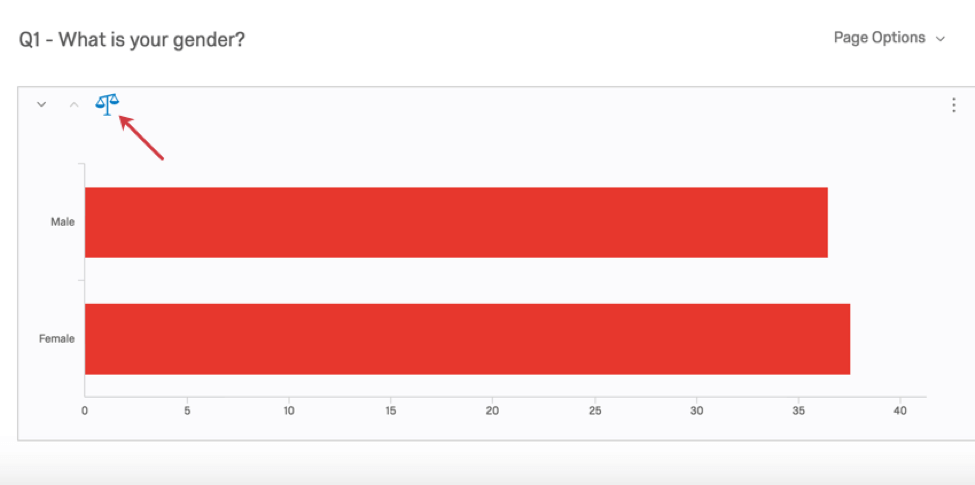
- Hover over the top left corner so that the blue scale icon appears.
- Click this icon so it turns gray.
Turning off Weighting for a Report
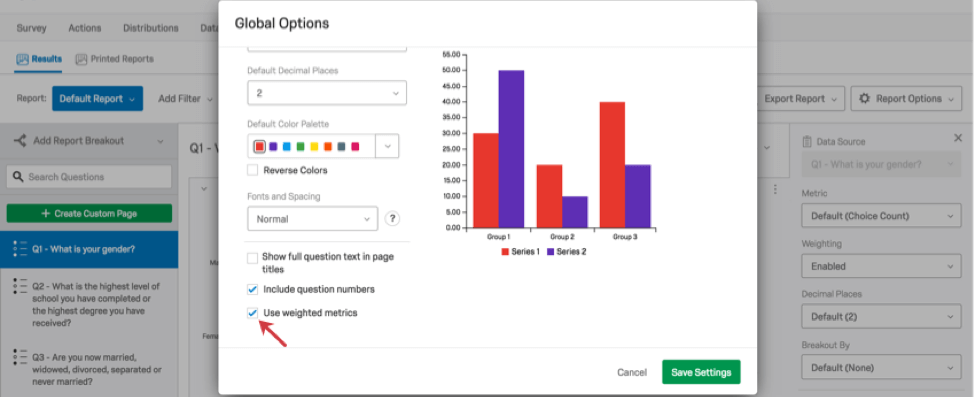
- Go to Report Options.
- Click Global Options.
- Deselect Use weighted metrics.
- Click Save Settings.
Compatible Variables
Any variable with a finite number of answer choices can be supported by response weighting. This includes:
- Single answer multiple choice questions
- Rank Order
- Pick, Group, and Rank
- Hot Spots and Heat Maps with defined regions
- Start Date or End Date by Day, Week, Month, Quarter, or Year
- Finished status
- Response Type
- Respondent Language
- Embedded Data set to Number Set or Text Set type
- Custom Tags
- Bucketed Variables
Variables where the answer choices are infinite – such as Text Entry fields – are not compatible.
Projects Where Responses Can Be Weighted
Response weighting is only available in a few different types of projects:
