New Dashboards Experience
About the New Dashboards Experience
Dashboards have been redesigned to make it easier for users to consume data in a meaningful way. Some of the highlights of this experience include:
- Improved screen-reader and keyboard accessibility.
- Better consistency with the rest of the XM interface.
- Simplified dashboard page management.
- More intuitive grouping of different dashboard actions.
- More flexible navigation that can be adjusted for screen width.
This page runs through the changes you can expect to see in the new experience in greater detail.
Enabling the New Dashboards Experience
The dashboard editor can opt into the new experience on an individual dashboard basis. Whatever you choose as the dashboard editor will apply for all users of that dashboard.
Opt into the new dashboard experience by clicking Try it now in the banner along the top of a dashboard.
You can also return to the original dashboard experience by clicking Switch back.
Navigating the Dashboard
Along the top of the dashboard, you’ll see a toolbar that displays the name of the dashboard page you’re on (e.g., “Overview”). You’ll also see a series of icons that let you complete important dashboard tasks.
- Edit dashboard: You must click this before you can start editing the dashboard (e.g., widgets, pages). The following screenshot shows how the Done editing button appears after it is clicked:

- Settings: Takes you to your dashboard settings. See more in the next section.
- Action planning: Takes you to your dashboard’s action planning. See CX vs. EX documentation.
- Text iQ: Takes you to your dashboard’s Text iQ. For CX Dashboards only.
Qtip: For performing text analysis on engagement, lifecycle, or ad hoc employee research, see Text iQ in the Data tab.
- Stats iQ: Takes you to your dashboard’s Stats iQ. For CX Dashboards only.
- Insights: View the Insights page, where you can identify areas of improvement and strength. See CX vs. EX documentation.
- Mobile preview: See how your dashboard will look on a mobile device. It is helpful if you’ve enabled a dashboard for viewing on the XM App.
Qtip: The mobile dashboard preview is not currently accurate in the new dashboards experience. While the preview will show all the left navigation dashboards, the actual mobile app will continue to use the existing mobile experience.
- Kiosk: Display the dashboard on a screen using kiosk mode. For CX Dashboards only.
- Export dashboard: Download the dashboard (CX|EX). In CX Dashboards, this also contains the option to email the dashboard.
- Share: Share your dashboard with other Qualtrics users. For CX Dashboards only.
Viewing & Managing Dashboard Pages
How you view and edit pages has changed in the new dashboard experience.
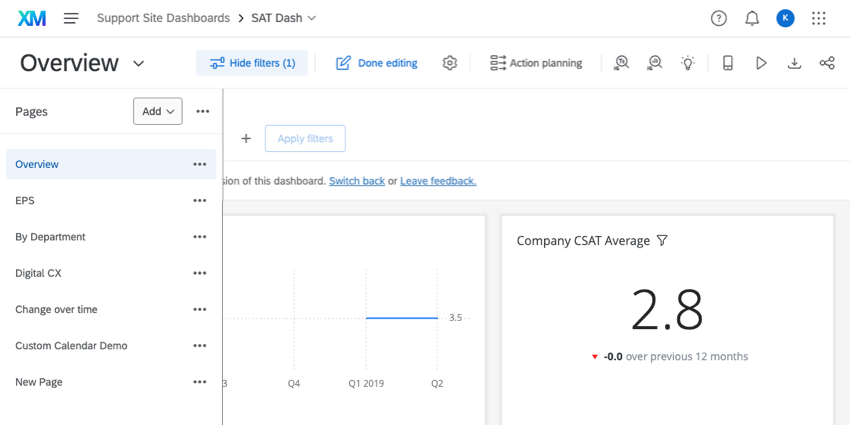
By default, your dashboard pages are displayed in a menu on the lefthand side of the dashboard. You can close this menu by clicking the pin icon, or re-pin it by clicking this same button again.
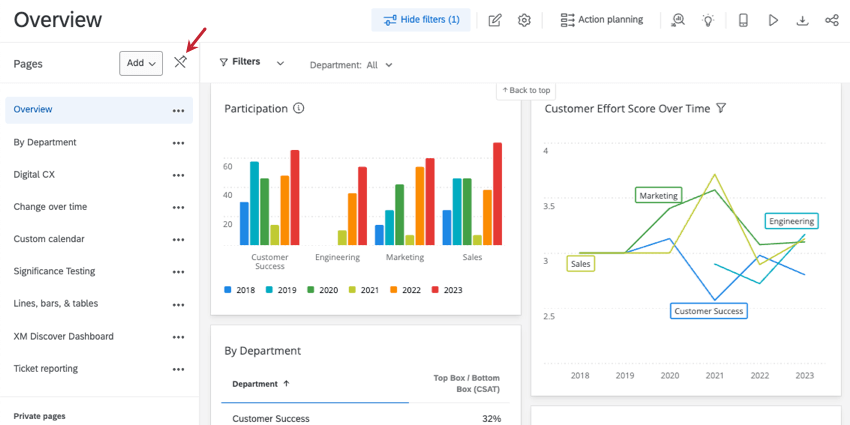

From the page menu, you can navigate the list of dashboard pages.
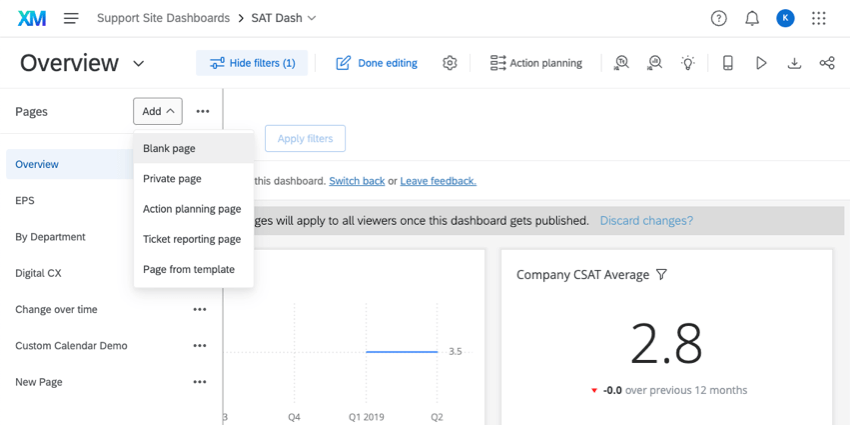
Click Add to add a new page to your dashboard. Learn more about the different page types and options on Creating CX Dashboard Pages.
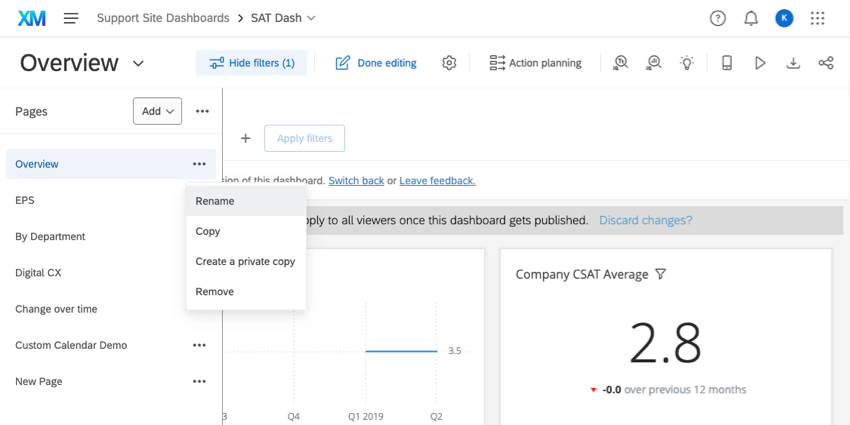
Click the button next to a page to see a list of options. “Duplicate” has been renamed to “Copy.”
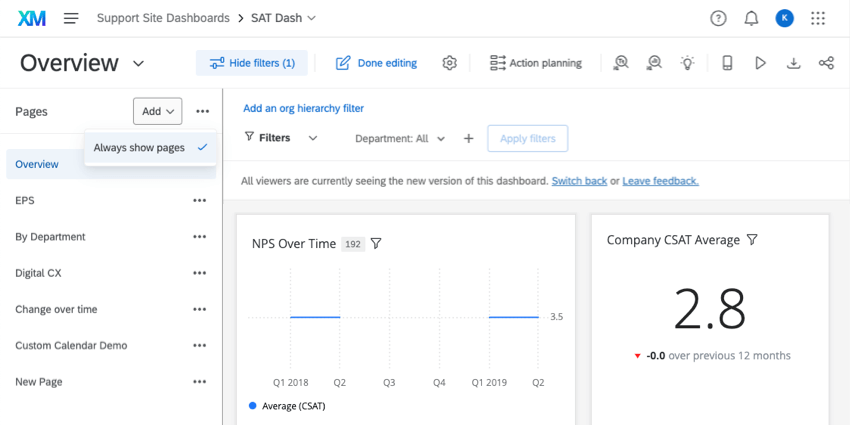
If you’d like to display your page list all the time, click the options next to the Add button, and select Always show pages. This setting applies to all of the dashboards you have switched to the new experience. You can deselect this option any time.
Dashboard Settings
- Click the settings gear.
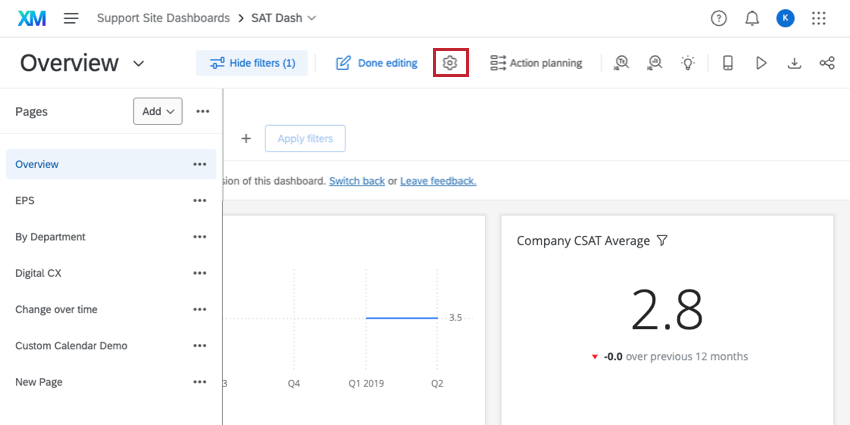
- You’ll be taken to a new page, where you’ll see a full list of dashboard settings.
- To return to your dashboard, use the Settings arrow in the top-left.
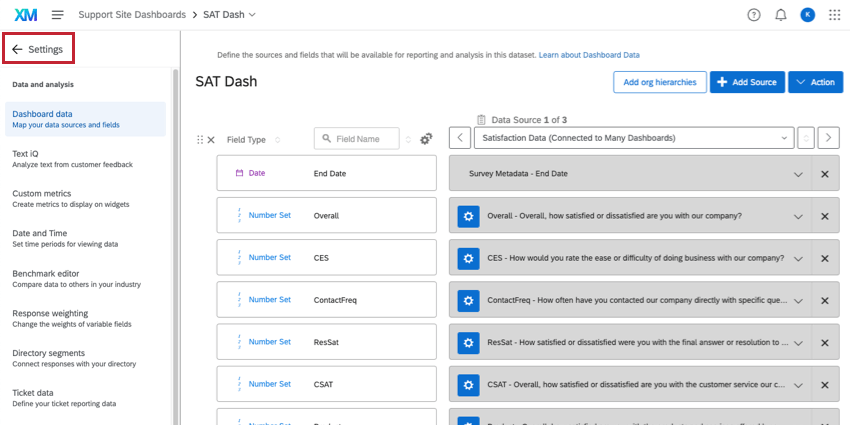
The dashboard settings available have not changed from the previous dashboard experience, except where noted:
- In EmployeeXM, Dashboard Settings is now labeled General. This is still the first page opened when you visit Settings.
- CX Dashboards now have a Date and Time page where time zones are configured. Other dashboards have not changed time zone settings.
Editing Widgets
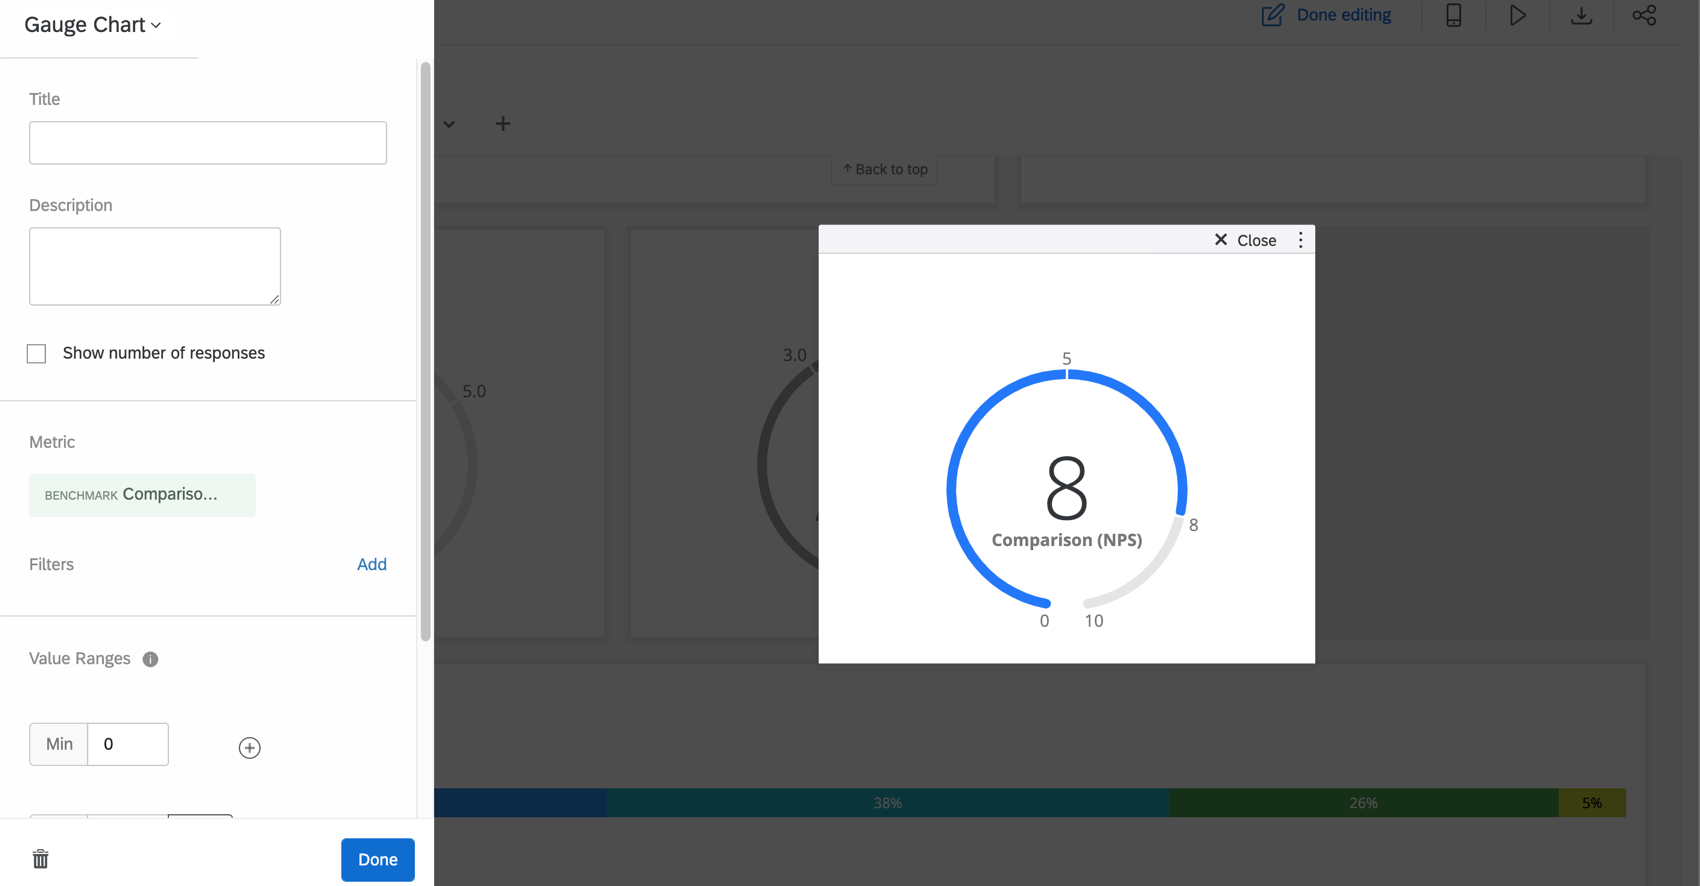
Very little has changed when it comes to editing dashboard widgets (EX|CX), except that the widget editing panel now appears to the left.
Viewing Tickets
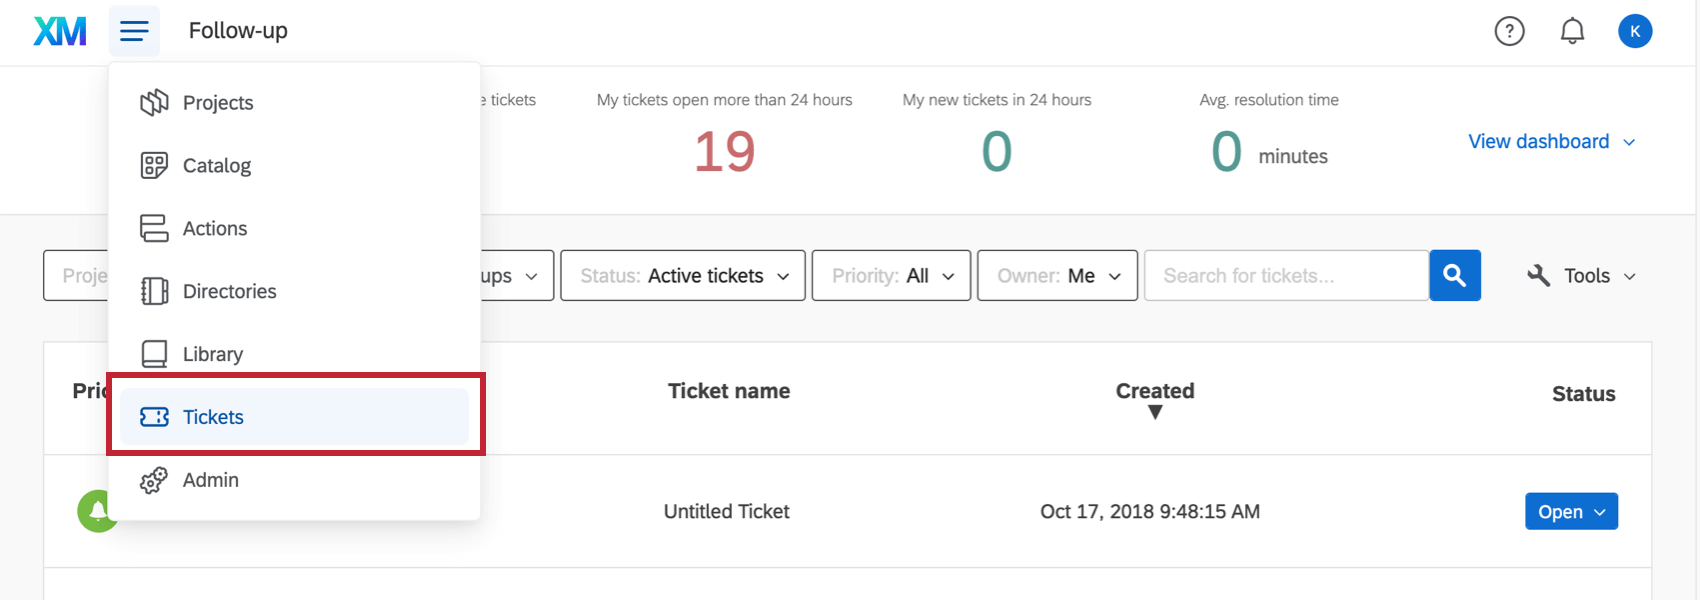
If you want to view and action your tickets, use the global navigation, and select Tickets.
Exporting Dashboard Pages
Exporting dashboard pages (CX|EX) is pretty much the same in the new dashboards experience, but with a few notable improvements in the export itself.
First, widgets now adjust size in PDF and JPG dashboard page exports to ensure readability.
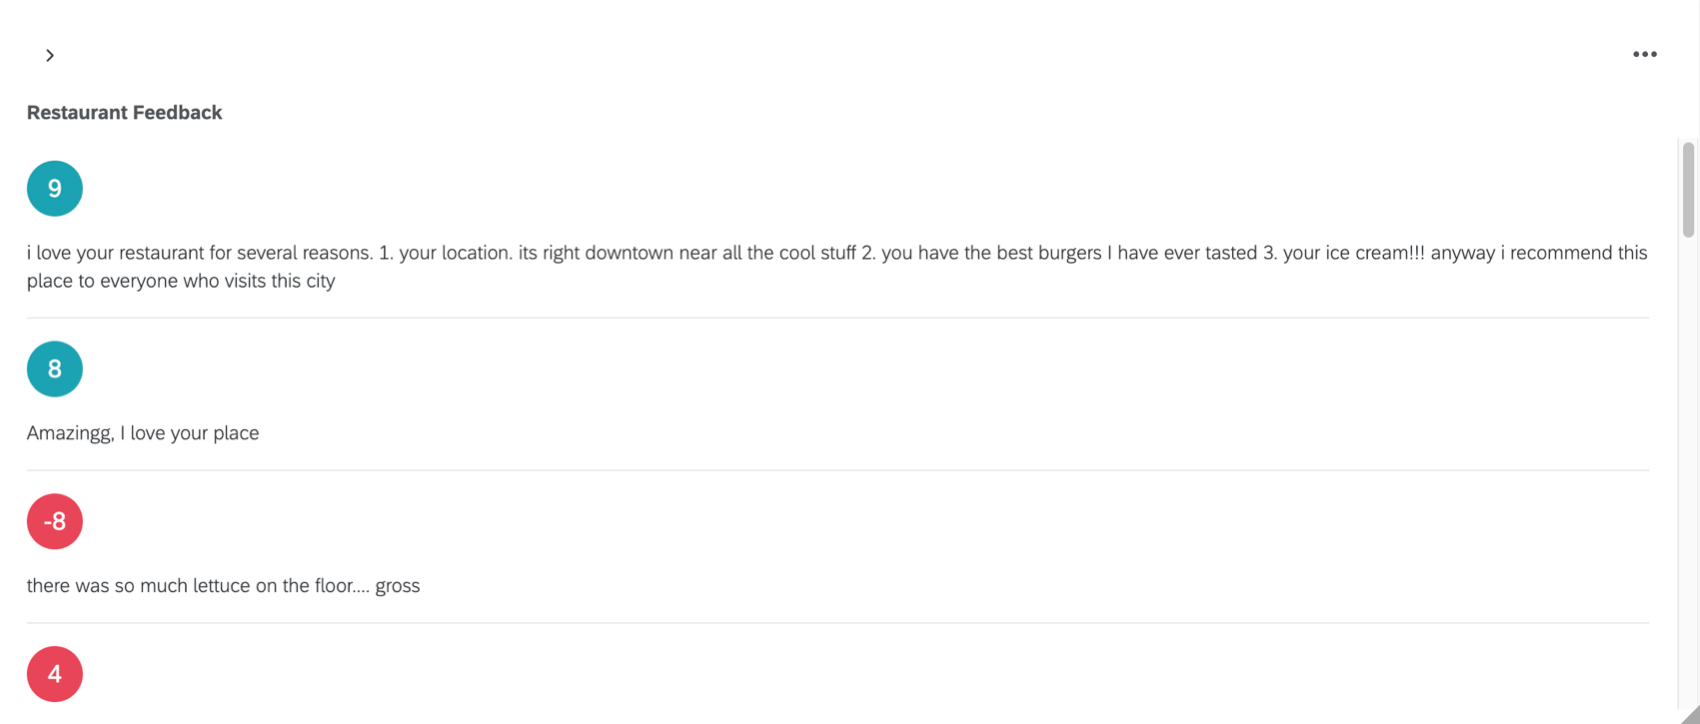
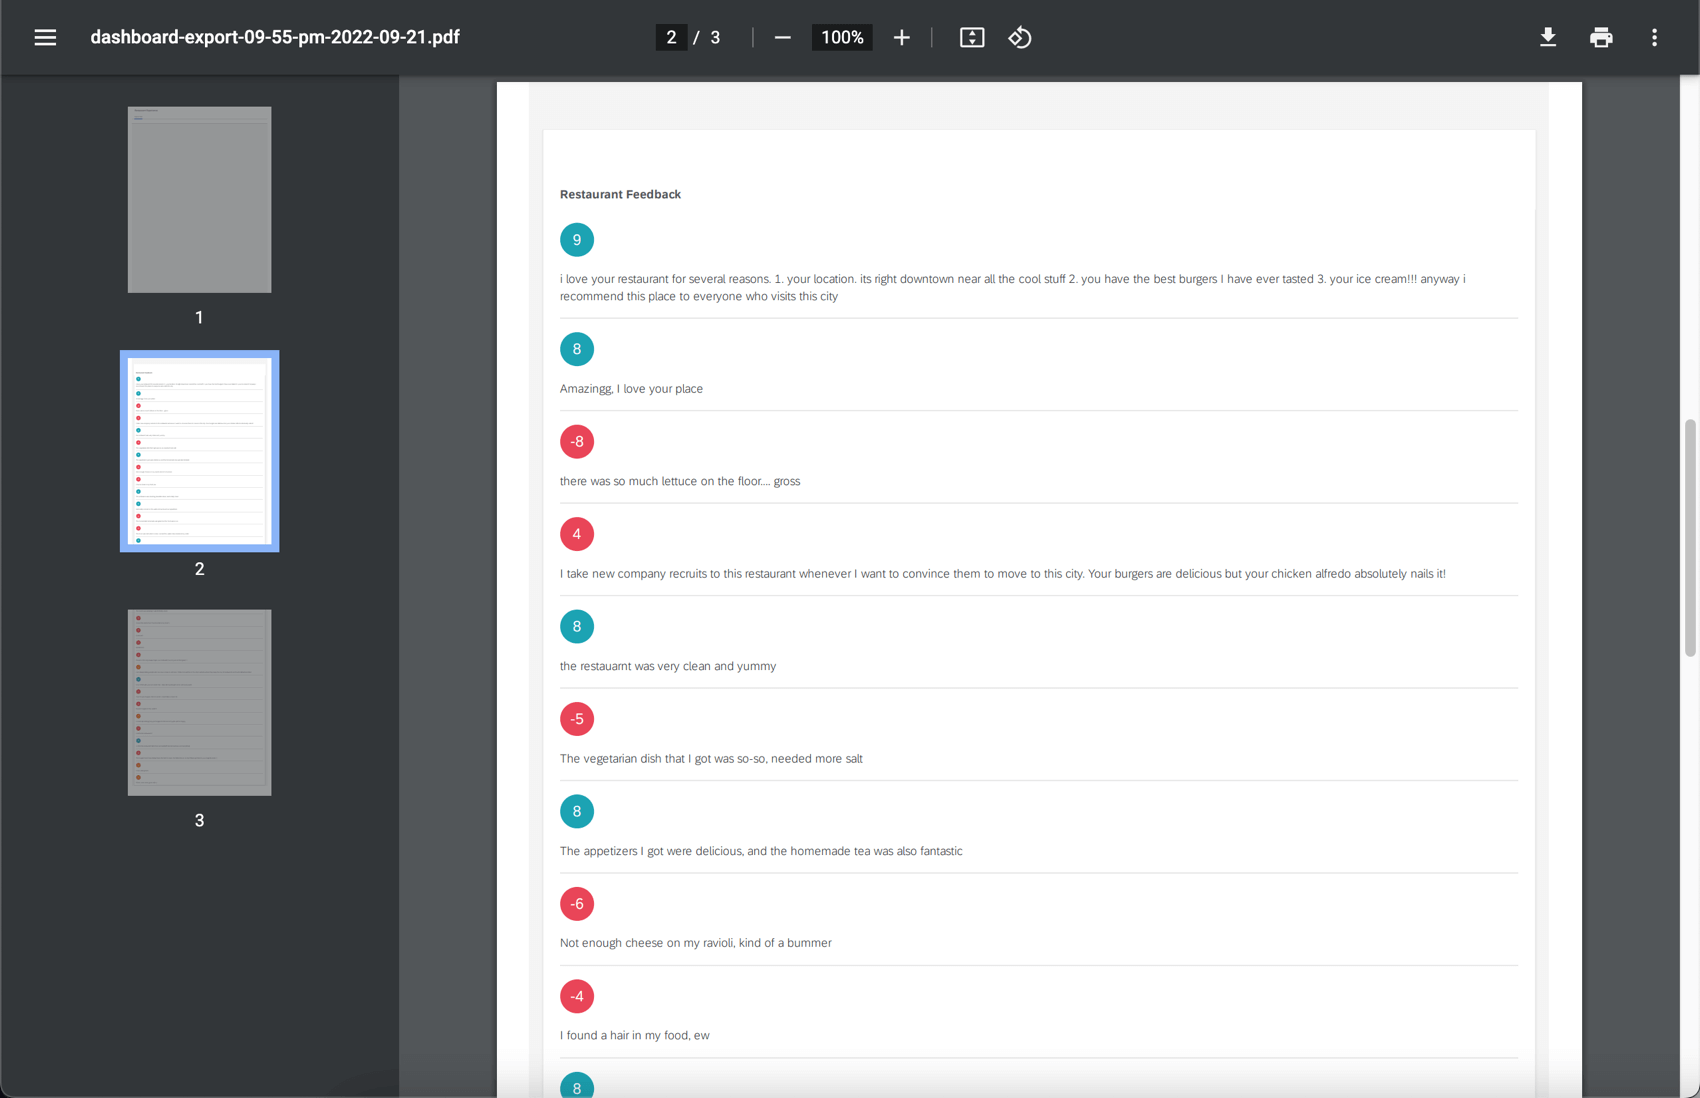
Secondly, some widgets contain so much data that dashboard viewers must scroll or navigate widget pages to see it all. So long as the widget is a table widget, response ticker widget, or record table widget, all of its data is included in the export.
Example: The following widget, which is cut off in the dashboard:
Would export to this multi-page file:


